Download
1 / 20
200 likes | 264 Vues
Explore the challenges and solutions in tracking marine vertebrates, featuring the Fishtracker Algorithm and satellite imagery integration. Learn about tagging technology and data integration for effective conservation efforts.

E N D
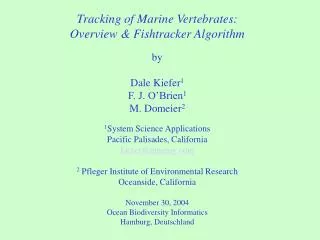
Tracking of Marine Vertebrates:Overview & Fishtracker AlgorithmbyDale Kiefer1F. J. O’Brien1M. Domeier21System Science ApplicationsPacific Palisades, Californiakiefer@runeasy.com2 Pfleger Institute of Environmental ResearchOceanside, CaliforniaNovember 30, 2004Ocean Biodiversity InformaticsHamburg, Deutschland
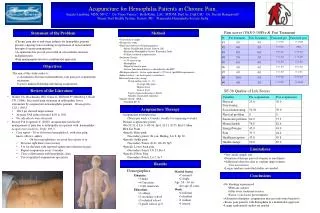
Statement of the Challenge Effective conservation of most marine vertebrate populations requires an assessment the life history of the species. Electronic tags offer the promise of filling some of the missing gaps. The community of scientists and resource managers using such tags have great need of an information system that fully integrates data they have acquired from tagged marine organisms with environmental information such as satellite imagery and data streams from weather buoys and drifters.
EASY software architecture Models • 4 dimensional system for marine applications WGS 84/geodetic representation • interfaces for models, spreadsheets, databases, and Internet • PC Desktop & Web-enabled GIS applications
Technical Challenge of Tracking Archival Tags:spatial/temporal matching of sst from tag and satellite image Satellite SST sensor sun Imagery time series = {time i, temperature (latitude j, longitude k)} clouds Tag time series = {time i, temperature i, depth i, irradiance i}
Figure 3. Step 5: Costing the arcs: a function of temperature match for candidate pixels and distance between consecutive pairs of candidate pixels Enumerate all possible arcs Start End Estimate liklihood/cost for each arc
Fig 4. Step 6: calculating the best path by summing the cost of cost of arcs for all possible paths Sum arc costs for all paths Select lowest cost path(s) Start End
Fig 1. Fish Tag Options Window • Unique features of the Fishtracker (O’Brien) Algorithm: • includes a consideration of maximum swimming speed of the fish • costs the distance to swim around land obstacles • calculates the most likely path as a global feature of the time series (analyzes thousands of possible paths) rather than a serial solution that is prone to much greater error
Fig.5. A typical display showing, simulation control, path, superimposed on satellite imagery, time series from tag
FishTracker SST-based latitude solutions vs. Wildlife Computers and Microwave Telemetry light-based latitude estimate False color contours illustrating relative importance of the range juvenile bluefin tuna occupy in the eastern Pacific; each color represents a relative importance increase of 20%. The polygon encloses 100% of position estimates for fish 159, 233, and 441 combined.
False color contours of seasonal spatial use and movement pattern for fish 159 and 233 combined. The smaller total range of fish 441 is illustrated by polygon.