The Normal Distribution
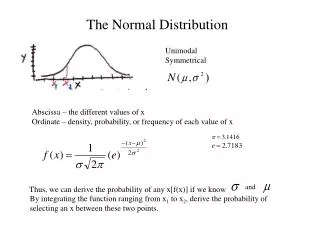
The Normal Distribution. Unimodal Symmetrical. Abscissa – the different values of x Ordinate – density, probability, or frequency of each value of x. and. Thus, we can derive the probability of any x[f(x)] if we know .

The Normal Distribution
E N D
Presentation Transcript
The Normal Distribution Unimodal Symmetrical Abscissa – the different values of x Ordinate – density, probability, or frequency of each value of x and Thus, we can derive the probability of any x[f(x)] if we know By integrating the function ranging from x1 to x2, derive the probability of selecting an x between these two points.
Using the Z Table Z-score = standardized score Mean to score (A) – (either to the left of mean or to the right), area or probability Larger portion (B) – area to the furthest tail from the score Smaller portion (C) – area to the closest tail from the score Larger + Smaller portion = 1 or 100% of the area [ A ] [ ---C ---- --- B ---- ---- ]
Standard Normal Distribution To solve the problem of there being an infinite number of normal distributions (differing in terms of means and standard deviations) we can transform the scores. With the rules of linear transformation, we change any normal distribution into a standard normal distribution. Then we only need one table to determine the probability of obtaining a given score, a greater score, or a smaller score. into Transform
We know: If ynew equals yold plus or minus a constant, then the new mean equals the old mean plus or minus the constant. If ynew equals yold divided by a constant, then the new standard deviation is equal to the old standard deviation divided by the constant. Thus to create a new mean of zero…..
10 15 20 25 -10 -5 0 5 10 -1.3 -0.6 0 0.6 1.3 Now we can use the z-table to to find the probability of… • A score less than Xold. • A score greater than Xold • Or any interval between two Xold points • Xold ---- to ---- Xnew or z-score ----- to ---- z-table. • z-table ----- to ---- z-score ------ to ----- Xold.
Examples Using the z-table y: 5,10,15,20,25 • What is the chance of a score being less than or equal to 5? 2. What is the chance of a score being greater than or equal to 5? 3. What is the chance of a score falling between 10 and 20? 4. What is the chance of a score falling between –10 and 18? 5. Within what two raw scores (be symmetrical) will 95% of the scores fall?
Setting Probable Limits: 95% Remember: Go to the z-table to find the z-scores that cover the range of 95%. Mean to z will be 0.475. Why? *We only have estimates. = 30.484 and -0.484