Download
1 / 9
90 likes | 125 Vues
Learn how to create impactful GIS presentations using charts and maps. Explore the types of charts and maps available, along with their key features and applications. Discover tips for improving map design, color selection, and symbolization.

E N D
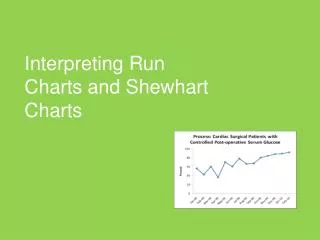
Presentation: Charts Bar • charts can be used to display tabular data. • the types of charts available in ArcView are typical of these available in GIS desktop systems • most systems have dynamic (as opposed to static) charting: charts automtically updated as data in underlying tables changes: • 6 types in ArcView: area, bar, column, line, pie, scatter Area Line Column Pie Scatter
Presentation: Maps What’s a map? "a representation, normally to scale and on a flat medium, of a selection of material or abstract features on , or in relation to, the surface of the earth.”International Cartographic Association Aspatial model of the real world, but differentiated from it by: abstraction, focus, simplification, symbolization scale, projection, and purpose
What’s in a Map? • Abstraction • Imaginary features (i.e. political boundaries) as well as physical features • Past, present, and future (archaeological sites, current, and planned roads) features • Focus • Selection and classification of features in real world to include in the map • Simplification • Simplification of complex features such as coastlines • Exaggeration of features that are too small to show at the scale of the map • Symbolization • Use of symbols or graphic to represent classified objects (e.g. church) • Scale • The ratio of distance on a map, to the equivalent distance on the earth's surface. • Projection • Representing curved surface of the earth on a flat plane. Distortion is inevitable. • Purpose • To describe, measure, communicate/persuade
Types of Maps 1. Planimetric (e.g municipal base map) A map designed to portray the horizontal positions of features; vertical information is specifically ignored. 2. Topographic (e.g. USGS 7.5 minute quads) A map designed to portray features on the surface of the Earth, including relief (elevation), hydrography, and cultural features. 3. Cadastral (e.g municipal parcel map) A map representing boundaries of land parcels, ownership, land use, valuation, and other related information. 4. Image (e.g LANDSAT image ‘map’) A map representing a remotely sensed picture or reflection of all or part of the Earth's surface • may or may not be orthomorphically correct. 5. Thematic (see next slide for types and examples) • A map used to visualize spatial relationships and patterns among information pertaining to some theme or concept (e.g. income)
Types of Thematic Maps Thematic Map: A map used to visualize spatial relationships and patterns among information pertaining to some theme or concept (e.g. income) • Choropleth map: uses zones or polygons to display information using shading, dot, density, or other techniques. • e.g population change, ethnicity distribution • Proximal (dasymetric) map: shows zones of constant attributes, such as soil type or vegetation (similar to choropleth except that data determines boundary lines; no pre-defined polygons) • e.g zoning, soil map • Isopleth map (contour or isarithmic) : shows a contiuous three dimensional surface such as elevation using lines connecting points of equal value (contours). • e.g elevation, travel time contours from a point(s), land values, income • Point (dot) or symbol map: shows information relating to specific points using marker sysmbols whose size and/or frequency relates to magnitude of phenomena • housing sales, code violations, crimes
Making Better Maps: some general principles • keep it simple, but don’t rely on software defaults • show only the area under study (e.g. if Texas, don’t show AK or LA counties): use small insert map to show relative location • Plan for final printing/publication scale • allow for size reduction (e.g. for report or journal publication), • point symbols visually reduce at twice the rate of line features (a function of area) • put title at top using ‘thick line’ font: serif/sans-serif; case not critical • map labels • best in serif font (letters have ‘tails’), with first letter upper and rest lower case • place above and to the right of the feature (2nd choice: above to left) • use font size hierarchy to indicate relative importance: US,Texas, Dallas • water features traditionally labelled in italic font • Create good map in black and white, then add color (not the reverse!) • 1 in 10 people are colorblind • people will xerox your map anyway
Making Better Maps: color and symbolization • Color concepts • Hue: the actual color (red, blue, etc) • Saturation: how much of it • Value: the amount of black Use low saturation in background, high saturation in foreground • choice of shading Quantitative data • symbols should have visual progression corresponding to data values • for polygons, use monochromatic color ramp: same color (hue), different saturation or value • can highlight top and bottom with contrasting color if desired • if use different fill patterns, be sure “visual progression” is achieved • for point symbols, use different sizes of the same symbol Qualitative data • For polygons, use different colors (polychromatic), or different fill patterns • For point symbols, use same size of different symbols • To create a color ramp for any two colors, hold CTRL key while selecting colors • be sure legend is big enough to clearly show different fill patterns
Making Better Maps: some tricks to use • Always include “neatline” around outside: ArcView uses this for positioning • Select Layout/add neatline to add neatline around outside of entire graphic • Use the same theme twice (be sure to remove copy from legend) • e.g. place theme with thin black line on top of a copy of the theme with thick red line • e.g. have separate theme for outline of polygons • Use buffering to create special effects (in View, select Theme/Create buffers) • e.g. along a shoreline, create multiple buffers then color ramp them • e.g.buffer within a polygon border, then save as new theme, and shade appropriately • Controlling scale of maps in Layouts • use copy to create a second frame of identical size • Be sure distance units and map units are set in View/ Properties for any View used • Set scale option in “View Frame Properties” box (double click on frame to set this) • Controlling size of point and line symbols in Layout • In View, double click on theme in TofC to open its Legend Editor • Click Advanced button, click Scale Symbols check box, type in Reference (output) scale • for dot patterns, keep density constant and change size of dots (rather than converse): but most software won’t do this! • Color, or use fill pattern (dots or stipple) for oceans and large water bodies • Use graphics design package for major customization • Export entire layout to graphics package • Use package to create a custom graphic then bring in as a picture/graphic