Download
1 / 11
110 likes | 232 Vues
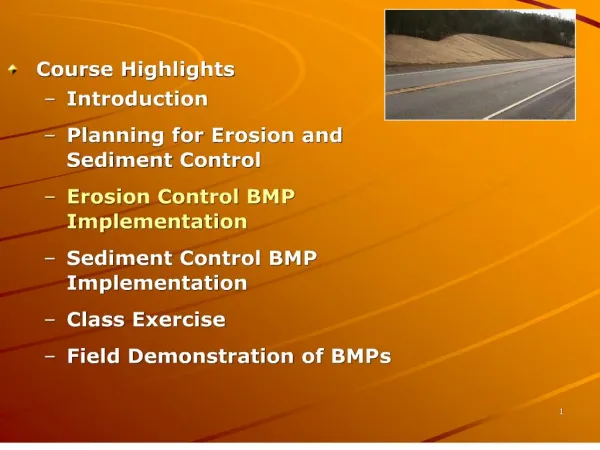
This study examines tidal sediment erosion in Maryland, focusing on Tilghman Island. The Department of Natural Resources has mapped over 6,944 miles of shoreline and analyzed 242,883 transects, revealing an average erosion rate of 20 cm/year. Key data issues include linear retreat measurements and bank composition analysis, which inform both bluff/bank and marsh erosion characteristics. Additionally, the impact of shoreline structures on erosion rates is discussed, along with accuracy and resolution challenges in regions with low erosion rates.

E N D
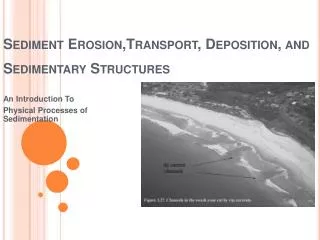
Estimating Tidal Sediment Erosion in Maryland Jeffrey Halka Lamere Hennessee Katie Offerman Department of Natural Resources Resource Assessment Service Maryland Geological Survey
Example from Tilghman Island White = 1845 Blue = 1942 Yellow = 1989 5000 feet
MD Data available • 6,944 miles of shoreline mapped • 242,883 transects • Average erosion rate of 20 cm/yr • Grain size/nutrients at 34 locations
Basic Data Issues • Measure of linear retreat • Vertical data from USGS Topographic sheets • Bank composition • Only from selected locations • Both bluff/bank and marsh • Emplacement of shoreline structures • Impact on average erosion rate calculation
Example from Tilghman Island White = 1845 Blue = 1942 Yellow = 1989 5000 feet
Basic Data Issues - 2 • Incomplete error analysis of historical erosion rate measurements • Both accuracy and resolution issues in areas of low erosion rate • Fastland vs. nearshore erosion