Download
1 / 21
210 likes | 393 Vues
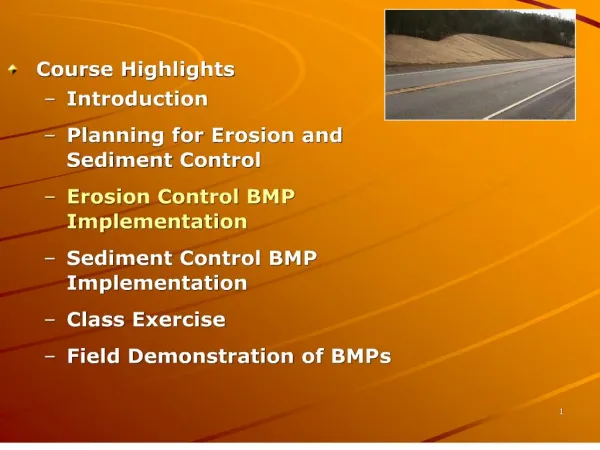
Investigate Reservoir Sediment and Watershed Erosion Using GIS. Tiao J. Chang and Travis D. Bayes Department of Civil Engineering Ohio University, Athens, Ohio, USA

E N D
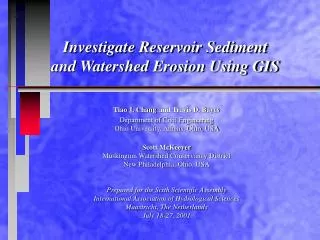
Investigate Reservoir Sedimentand Watershed Erosion Using GIS Tiao J. Chang and Travis D. Bayes Department of Civil EngineeringOhio University, Athens, Ohio, USA Scott McKeeverMuskingum Watershed Conservancy DistrictNew Philadelphia, Ohio, USAPrepared for the Sixth Scientific AssemblyInternational Association of Hydrological SciencesMaastricht, The NetherlandsJuly 18-27, 2001
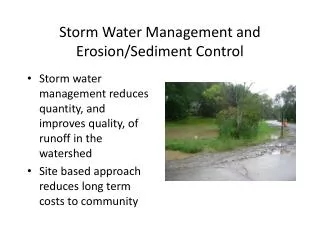
Charles Mill Lake Black Fork of the Mohican River • Original Volume* = 11,369 acre-ft • Current Volume* = 8,129 acre-ft • Sediment Volume* = 3,139 acre-ft • 28% Loss of Volume • Used by MWCD for Public Recreation • Need for Dredging U.S. 30 Rt 430 Rt 603 Charles Mill Lake *Note: Data is as of 1993
Wetland View 1 As a Wetland!
Collecting Samples • Used GPS and USGS Maps for back-up • 60 sediment sample sites were selected 1. Retrieving the Samples (4 days) 2. Bagging the Samples for Transport
Recording Attributes - Recorded UTM coordinates, sample #, general grain size and color with Munsell Chart - Ground sediment and sieve analysis (8 weeks)
Uniformity Image • Gravelly if Cu>4