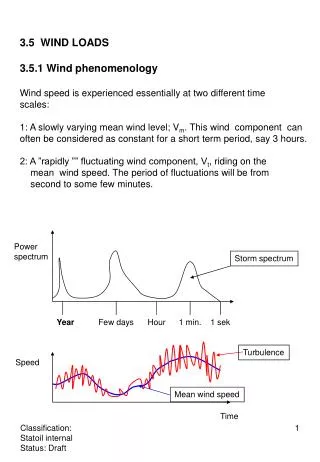
Optimizing Speed Plots for Freeways - Scaled Data Analysis
310 likes | 411 Vues
Explore the best scale for speed plots of all freeways in Portal by setting a uniform scale (min_speed - max_speed). Analyze and compare speed data for I-5 N and US 26 W for different scales on specific dates in 2005. Track changes in speed and determine the most suitable scale for an accurate representation.

Optimizing Speed Plots for Freeways - Scaled Data Analysis
E N D
Presentation Transcript
Speed Plots For Different Scales AIM: To decide the best scale for speed plots and fix a single scale (min_speed -max_speed) for all Freeways in Portal.
INDEX 1 • Speed Plot For I-5 N For Scale 0 to 70 on Jan 5 2005 • Speed Plot For I-5 N For Scale 0 to 75 on Jan 5 2005 • Speed Plot For I-5 N For Scale 0 to 80 on Jan 5 2005 • Speed Plot For I-5 N For Scale 0 to 85 on Jan 5 2005 • Speed Plot For I-5 N For Scale 0 to 90 on Jan 5 2005 • Speed Plot For I-5 N For Scale 0 to 95 on Jan 5 2005 • Speed Plot For I-5 N For Scale 0 to 100 on Jan 5 2005 • Speed Plot for I-5 N For Scale 0 to 70 on June 26 2005 • Speed Plot for I-5 N For Scale 0 to 75 on June 26 2005 • Speed Plot for I-5 N For Scale 0 to 80 on June 26 2005 • Speed Plot for I-5 N For Scale 0 to 85 on June 26 2005 • Speed Plot for I-5 N For Scale 0 to 90 on June 26 2005 • Speed Plot for I-5 N For Scale 0 to 95 on June 26 2005 • Speed Plot for I-5 N For Scale 0 to 100 on June 26 2005 • NEXT INDEX PAGE
INDEX 2 • Speed Plot For US 26 W For Scale 0 to 70 on Jan 5 2005 • Speed Plot For US 26 W For Scale 0 to 75 on Jan 5 2005 • Speed Plot For US 26 W For Scale 0 to 80 on Jan 5 2005 • Speed Plot For US 26 W For Scale 0 to 85 on Jan 5 2005 • Speed Plot For US 26 W For Scale 0 to 90 on Jan 5 2005 • Speed Plot For US 26 W For Scale 0 to 95 on Jan 5 2005 • Speed Plot For US 26 W For Scale 0 to 100 on Jan 5 2005 • Speed Plot For US 26 W For Scale 0 to 70 on June 26 2005 • Speed Plot For US 26 W For Scale 0 to 75 on June 26 2005 • Speed Plot For US 26 W For Scale 0 to 80 on June 26 2005 • Speed Plot For US 26 W For Scale 0 to 85 on June 26 2005 • Speed Plot For US 26 W For Scale 0 to 90 on June 26 2005 • Speed Plot For US 26 W For Scale 0 to 95 on June 26 2005 • Speed Plot For US 26 W For Scale 0 to 100 on June 26 2005 • PREVIOUS INDEX PAGE
Speed Plot For I-5 N For Scale 0 to 100 on Jan 5 2005 • BACK
Speed Plot for I-5 N For Scale 0 to 70 on June 26 2005 • BACK
Speed Plot for I-5 N For Scale 0 to 75 on June 26 2005 • BACK
Speed Plot for I-5 N For Scale 0 to 80 on June 26 2005 • BACK
Speed Plot for I-5 N For Scale 0 to 85 on June 26 2005 • BACK
Speed Plot for I-5 N For Scale 0 to 90 on June 26 2005 • BACK
Speed Plot for I-5 N For Scale 0 to 95 on June 26 2005 • BACK
Speed Plot for I-5 N For Scale 0 to 100 on June 26 2005 • BACK
Speed Plot For US 26 W For Scale 0 to 70 on Jan 5 2005 • BACK
Speed Plot For US 26 W For Scale 0 to 75 on Jan 5 2005 • BACK
Speed Plot For US 26 W For Scale 0 to 80 on Jan 5 2005 • BACK
Speed Plot For US 26 W For Scale 0 to 85 on Jan 5 2005 • BACK
Speed Plot For US 26 W For Scale 0 to 90 on Jan 5 2005 • BACK
Speed Plot For US 26 W For Scale 0 to 95 on Jan 5 2005 • BACK
Speed Plot For US 26 W For Scale 0 to 100 on Jan 5 2005 • BACK
Speed Plot For US 26 W For Scale 0 to 70 on June 26 2005 BACK
Speed Plot For US 26 W For Scale 0 to 75 on June 26 2005 BACK
Speed Plot For US 26 W For Scale 0 to 80 on June 26 2005 BACK
Speed Plot For US 26 W For Scale 0 to 85 on June 26 2005 BACK
Speed Plot For US 26 W For Scale 0 to 90 on June 26 2005 BACK
Speed Plot For US 26 W For Scale 0 to 95 on June 26 2005 BACK
Speed Plot For US 26 W For Scale 0 to 100 on June 26 2005 BACK