Download
1 / 15
150 likes | 180 Vues
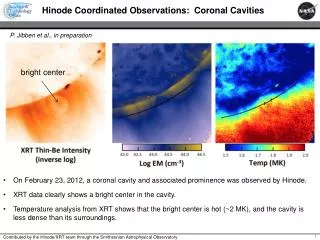
Investigate heating mechanisms in microflares using RHESSI and Hinode data, analyzing plasma heating and electron acceleration processes. Study spectral analysis and corrections for accurate insights. Explore implications of flow patterns on temperature observations.

E N D
Microflare Heating From RHESSI and Hinode Observations Ryan Milligan NASA-GSFC Ryan Milligan NASA/GSFC
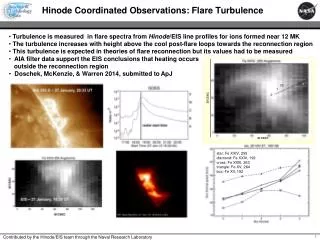
Energy released during flares… • Is divided between: • Directly heating plasma in the corona at the magnetic reconnection site • Accelerating electrons out of the thermal distribution • These in turn drive chromosphericevaporation, filling the loop with high-temperature plasma This aim of this study is to investigate the mechanism responsible for unusually high-temperatures observed during a microflare using RHESSI and Hinode Ryan Milligan NASA/GSFC
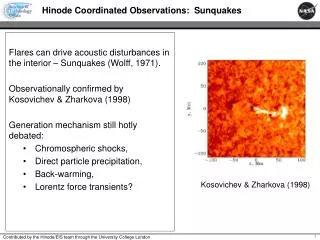
He II Fe XXIV Fe XII 6-12 keV Fe XV SOT Ca II EIS Fe XV XRT Ti_poly Red = downflows Blue = upflows Ryan Milligan NASA/GSFC
RHESSI Spectral Analysis • Spectrum taken from 1 minute at flare peak • Corrections for pulse pile-up and gain offset were applied Ryan Milligan NASA/GSFC
Gain offset correction • Before the anneal RHESSI calibration was poorly known • Data could be modified manually by fine-tuning the gain offset • drm_mod works only for single detector Ryan Milligan NASA/GSFC
Gain offset correction • Before the anneal RHESSI calibration was poorly known • Data could be modified manually by fine-tuning the gain offset • drm_mod works only for single detector Ryan Milligan NASA/GSFC
Pileup correction • Criteria for pileup • Total counts >104 • Excess emission at ~13 keV (twice the peak at 6.7 keV in A0 state) • pileup_mod works only for single detector Ryan Milligan NASA/GSFC
Pileup correction • Criteria for pileup: • Total counts >104 • Excess emission at ~13 keV (twice the peak at 6.7 keV in A0 state) • pileup_mod works only for single detector Ryan Milligan NASA/GSFC
Spectral Fit Results • Peak temperature of 15±1 MK • No evidence for nonthermal emission • Presence of Fe/Ni feature at 8 keV confirms high-continuum temperature Ryan Milligan NASA/GSFC
Feldman et al. (1996) Hannah et al. (2008) Statistics of Flare Temperatures Ryan Milligan NASA/GSFC
Klimchuk et al. (2008) EBTEL 0D hydro-code • Models plasma parameters for various forms of injected energy • Peak temp is higher when less energy is used to accelerate electrons Ryan Milligan NASA/GSFC
Ryan Milligan NASA/GSFC
If the flow in XRT is real: • Plasma flows left to right along the loop • Evaporation occurs at X-ray temperatures • Fe XV redshifts are “chromospheric condensation” due to the overpressure of rising material - too hot according to models - requires electron beam • Blueshifts at right FP are due to the heat flux along the loop Ryan Milligan NASA/GSFC
If flow in Fe XV is real: • Plasma flows from right to left along the loop • Brightening in XRT is actually a build up of hot material being deposited in the left leg of the loop • Upflow velocity consistent with evaporation due to thermal conduction Ryan Milligan NASA/GSFC
Conclusions • Above-average temperature of 15 MK was observed during a B-class flare • Absence of nonthermal emission plus low-velocity upflows suggest that direct heating in the corona was responsible • Consistent with recent hydrodynamical model • Evaporation still required to supply material to corona • Contradicting flow patterns were observed by EIS and XRT Ryan Milligan NASA/GSFC