Exploring Vibroseis Techniques in Seismology: SAGE 2008 Insights
Discover the innovative Vibroseis techniques showcased in the SAGE 2008 conference, focusing on the Budaghers Fault Profile and Vibe Controller (Pelton). This presentation features video demonstrations by Larry Braile from Purdue University, highlighting key concepts like the triggering of sweep signals and cross-correlation methods for capturing seismic reflections. Gain a deeper understanding of Vibroseis schematics and their applications in exploring Earth's subsurface structures.

Exploring Vibroseis Techniques in Seismology: SAGE 2008 Insights
E N D
Presentation Transcript
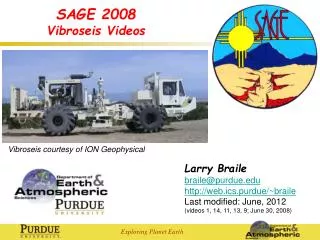
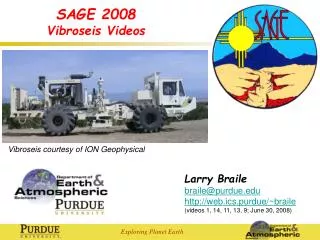
SAGE 2008 Vibroseis Videos Vibroseis courtesy of ION Geophysical Larry Braile braile@purdue.edu http://web.ics.purdue/~braile (videos 1, 14, 11, 13, 9; June 30, 2008) Exploring Planet Earth
Watch here and here Time (10 s) The “Pad” and the Sweep (schematic) 10 Hz 80 Hz
Figure 1. Vibroseis Schematic After Lindseth, 1968
Figure 1. Vibroseis Schematic – Cross Correlation with pilot After Lindseth, 1968
Figure 1. Vibroseis Schematic – Cross Correlation, 1st Reflection Maximum positive correlation at this position After Lindseth, 1968
Figure 1. Vibroseis Schematic – Cross Correlation, 2nd Reflection Maximum negative correlation at this position After Lindseth, 1968
Figure 1. Vibroseis Schematic – Cross Correlation, 3rd Reflection Maximum positive correlation at this position After Lindseth, 1968