Download
1 / 1
10 likes | 100 Vues
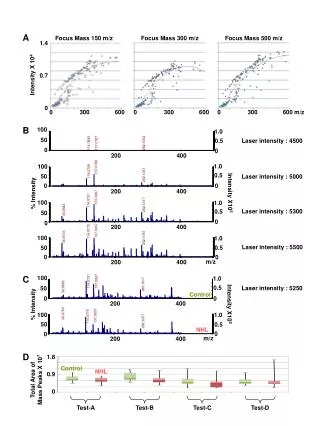
Dive into intricate mass spectrometry data analysis focusing on laser intensity variations and peak areas for NHL testing. Explore the impacts of laser intensity on mass peaks in Test-A, Test-B, Test-C, and Test-D in this comprehensive study.

E N D
A Focus Mass 150 m/z Focus Mass 300 m/z Focus Mass 500 m/z 1.4 0.7 0 Intensity X 104 0 300 600 0 300 600 0 300 600 m/z B 100 1.0 Laser intensity : 4500 50 0.5 282.1062 114.0685 137.0787 0 0 200 400 1.0 100 137.0786 114.0709 Laser intensity : 5000 0.5 50 282.1037 0 0 Intensity X105 200 400 % Intensity 137.0807 114.0721 100 1.0 282.1017 Laser intensity : 5300 38.9682 0.5 50 0 0 200 400 137.0937 114.0775 100 1.0 38.9703 282.1057 Laser intensity : 5500 50 0.5 0 0 m/z 200 400 C 100 1.0 137.0807 114.0721 282.1017 Laser intensity : 5250 0.5 38.9682 50 Control 0 0 Intensity X105 200 400 % Intensity 100 1.0 38.9703 137.0937 114.0775 282.1057 50 0.5 NHL 0 0 m/z 200 400 D 1.8 0.9 0 Control NHL Total Area of Mass Peaks X 107 Test-A Test-B Test-C Test-D