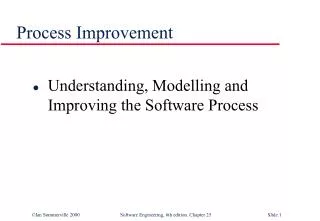
Enhancing RTI and Behavioral Processes: Insights and Strategies for Improvement
Join facilitators Bill Trant, Susan Cole, and Leigh Gates as they present key data and strategies for improving Response to Intervention (RTI) and behavioral processes within schools. This session includes a detailed description of the RTI process, a review of significant behavioral data disparities, small group discussions to address what works and what needs improvement, and a wrap-up focused on continuous improvement performance plans. Engage with insights on the disproportionate representation of students by race/ethnicity in behavior interventions.


Enhancing RTI and Behavioral Processes: Insights and Strategies for Improvement
E N D
Presentation Transcript
RTI and Behavior Process Improvement Group Facilitators: Bill Trant, Susan Cole, & Leigh Gates
Agenda • Presentation of the Data • Description of the Process • What Works? • Small Group Discussion & Whole Group Share • What Needs to Work Better? • Small Group Discussion & Whole Group Share • Wrap-up
The Continuous Improvement Performance Plan Indicator 4b Indicators 9 and 10 The State-Level Perspective
Indicator 4b Significant Discrepancy of > 10 Day Suspensions by Race/Ethnicity Due to 2009-2010 Data • 1,073 total students suspended • 78 (7.3%) students with IEPs • More than 2 times discrepant in the number of suspensions by race/ethnicity (African American)
Indicator 9 & 10 Disproportionate Representation by Race/Ethnicity in Disability Categories That is a Result of Inappropriate Identification 2010-2011 Data • 2 categories: ID-MI (82/133) and SED (63/105). • ID-MI risk ratio: 6.2% NHCS > 5.36% State • SED risk ratio: 6% NHCS > 5% State • Disproportionate in the identification of African American students in these two categories
RTI from a system perspective A break down of data in terms of Behavior Intervention A break down of Behavior Intervention in terms of Tiers The District-Level Perspective
Entitlements by Behavior State Child Count (SED/Total)= 4% KEY: B= Behavior; At= Entitled in Attention; Ag: Entitled in Aggression; 2 B= Entitled in 2 Behaviors
K-5 Students Provided Interventions in Tiers 2009-2010 2010-2011 • 3,501* (30% ADM) in RTI • 1,696 (48%) intervention info. • 639** (38%) cases = behavior • 539 * (84%) tier information • 3,250* (29% ADM) in RTI • 1,261 (39%) intervention info. • 345** (27%) cases = behavior • 292 * (85%) tier information 4 4 7 (2%) 3 (1%) 3 3 89 (17%) 51 (17%) 2 2 237 (37%) 112 (38%) 1 1 193 (36%) 122 (42%) * Based on 25 schools **Based on 25 sch. w/3-4 w/<50% of data * Based on 25 schools **Based on 20 sch. w/8-9 w/<50% of data
6-8 Students Provided Interventions in Tiers 2009-2010 2010-2011 • 418* (8% ADM) in RTI • 197 (47%) intervention info. • 24** (12%) cases = behavior • 24* (100%) tier information • 907* (17% ADM) in RTI • 401 (44%) intervention info. • 71** (18%) cases = behavior • 63* (89%) tier information 4 4 1 (2%) 1 (4%) 3 3 0 (0%) 12 (19%) 2 2 6 (25%) 36 (57%) 1 1 17 (71%) 14 (22%) * Based on 7 schools **Based on 7 sch. w/2 w/<50% of data * Based on 7 schools **Based on 5 sch. w/3 w/<50% of data