Download
1 / 6
140 likes | 1.32k Vues
Levels of measurement of data. The lesson aim is that by the end of this lesson you will be able to identify the 3 levels of data. You will understand that knowing the level of data helps you decide which statistical test to use.

E N D
Levels of measurement of data The lesson aim is that by the end of this lesson you will be able to identify the 3 levels of data. You will understand that knowing the level of data helps you decide which statistical test to use. You will know that we use statistical tests to decide if we can reject the null hypothesis or not.
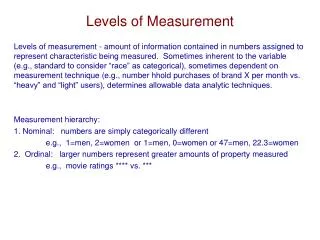
Quantitative data • When we collect quantitative data (numbers) there are four different types of data we can collect. • A level students need to know three of these. ‘NOIR’
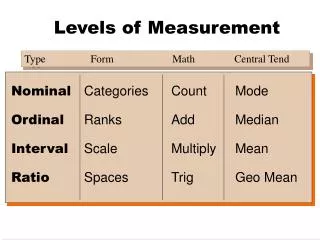
Nominal data • Data are placed into categories. • e.g. counting the numbers of 6.1 and 6.2 students who eat chips at lunchtime. • This provides little information; we simply know how many students of each year group eat chips. • Another example – how many people in the room have Blue eyes? Brown eyes? Green eyes?
Ordinal data • Data are placed into an order. • e.g. finding the most popular meal by asking students to rank their favourite foods in order (e.g. first to fifth). • The gap between each ranking is unclear. For example, if someone rates chips 1st and salad 2nd do they like chips twice as much as salad. • If you can calculate the median from the data then it is ORDINAL
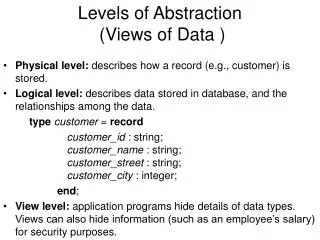
Interval data • Data are measured precisely using a fixed scale. • The Intervals between the measurements are precise • e.g. measuring how much money students spend on meals. If all the meals cost the same this will give an accurate measure of how much money was spent (e.g. £2 is exactly twice £1). • But it still may not tell us why participants do what they do.
Ratio data • Like Interval but can go below ‘0’ – temperature for example