Download
1 / 29
300 likes | 588 Vues
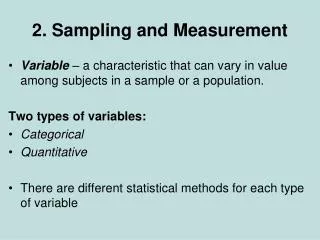
Sampling and levels of measurement. Data collection. Sampling terms. Population: all subjects one is interested in. Very large or very small Element Sample: portion of population Sampling frame: list of people (elements) in the population. Sampling.

E N D
Sampling and levels of measurement Data collection
Sampling terms • Population: all subjects one is interested in. Very large or very small • Element • Sample: portion of population • Sampling frame: list of people (elements) in the population
Sampling • Representative sample: if the overall characteristics of the sample approximate the important characteristics of the population • Biased sample: not representative • Why sample? time and money
Terms • Parameters and statistics Parameters: population Statistics: samples
Sampling in the U.S. • Literary Digest polls. Accurate until 1936, when Landon was predicted as winner of the presidential election • Reasons: (1) low return rates (2 million out of 10 million) and (2) sampling frame (telephone directories and lists of auto owners) • Poor sampling frames result in bias
Sampling in the U.S. • 1948 Gallup poll predicted Dewey would win. Problems: (1) stopped polling in Oct.; (2) quota sampling • Two types of sampling: probability and non-probability sampling • Probability sampling uses the laws of probability, whereas non-probability does not
Probability • p = number of times an event could occur / total number of outcomes. • Can be expressed as a fraction, a %, as chances out of 100, or as a decimal. • P can range from 0 (no probability to 1 (certainty)
Sampling • A sample will be more likely to be representative of a population from which it is selected if all members of the population have an equal chance of being selected in the sample
Sampling • Sampling error: error due to the fact that the sample is not representative • Necessity of a complete sampling frame
Probability sampling • Simple random sampling: (out of a hat, random numbers) • Systematic random sampling: every nth element is cnosen, select first element at random (random start)
Probability sampling • Stratified random sampling • 1. Divide sample into subgroups based on important population characteristics • 2. Randomly sample from those subgroups in proportion to their percentage in the population
Probability sampling • Choice of stratification variables will often depend on what variables are available, and how much is known about the population • This technique most likely to be representative
Non-probability sampling • Probability sampling only works if there is a sampling frame of the population. Sometimes that is not possible (i.e., criminals, drug addicts, etc.) • Nonprobability sampling methods, while running the risk being unrepresentative might be the only option
Non-probability sampling • Convenience: the captive audience • College students and prisoners • Purposive: researcher uses judgment • For example, the mentally ill. Works best if the criteria for inclusion are clear
Quota: like stratified random. Groups are selected on the basis of known variables • In quota sampling, subjects are not selected randomly--subjects with the desired characteristics are selected until a quota is filled for each subgroup
Non-probability sampling • Snowball: each subject is asked to suggest other subjects
Tips about sampling • Sample size: unusually the number of subjects needs to be at least 30. If several groups within the sample are to be compared, there needs to be at least 10 per group. • The larger the number of subjects (N), the less likely sampling error
Tips about sampling • There will always be “mortality” • Samples should be larger to take this into account
Tips about sampling • The greater the heterogeneity of the sample, the larger the sample must be. The less population diversity, the smaller N might be. • N is often determined by time and money factors
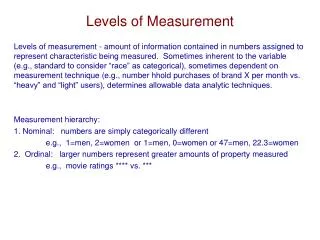
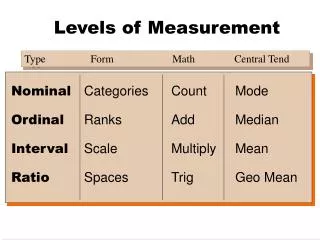
Levels of measurement • Nominal And • Ordinal (nonparametric) • Interval • And • Ratio (parametric)
Nominal • Nominal: lowest level, simply classifying observations into categories • Categories should be mutually exclusive and exhaustive • Examples: gender, major, religion, state
Nominal (continued) • Numbers assigned to the categories have no numerical meaning. Assign individuals, and report the % falling into each category. • Fewer statistical techniques can be used
Ordinal measurement • Ordinal measurement: one observation represents more of a given variable than another observation • Rankings • Newly developed tests
Ordinal (continued) • Ranks tell whether one observation represents more or less than another, but not how much more or less--nothing is known about the exact difference between any two ranks • Rankings of crime seriousness
Interval • Interval: like an ordinal scale, but has equal intervals between the units of measurement. Not only an ordering, but also the same distance or degree of difference between observations • For example, 81 is 1 point away from 80, etc.
Well-developed tests are interval level • With interval measurement, can do addition, subtraction, multiplication and division, more statistical tests
Ratio measurement • Ratio measurement: like interval, with the additional property of a true zero. • An individual could have two or three time as much of a trait as another with ratio measurement
Ratio • Height or weight. A 200 lb person weighs twice as much as a 100 pound person • Not true for interval. For example, no such thing as an IQ of 0, and a person with an IQ of 100 is not twice as smart as someone with an IQ of 50