Download
1 / 22
220 likes | 244 Vues
Learn about frequency distributions, levels of measurement, inferential statistics, graphing data, and the scientific investigation stages for accurate data interpretation. Understand nominal, ordinal, interval, and ratio measurements. Explore Likert scales, frequency distribution types, and graphing techniques for effective data visualization and analysis.

E N D
Frequency distributions and graphing data: Levels of Measurement Frequency distributions Graphing data
Stages in scientific investigation: Obtain your data: Usually get data from a sample, taken from a population. Descriptive statistics: Reveal the information that's lurking in your data. Inferential statistics: Use data from a sample to reveal characteristics of the population from which the sample data were presumably selected.
Levels of measurement: 1. Nominal (categorical or frequency data): When numbers are used as names. e.g. street numbers, footballers' numbers. All you can do with nominal data is count how often each number occurs (i.e. get frequencies of categories).
2. Ordinal: When numbers are used as ranks. e.g. order of finishing in a race: the first three finishers are "1", "2" and "3", but the difference between "1" and "2" is unlikely to be the same as between "2" and "3". Many measurements in psychology are ordinal data - e.g., attitude scales.
1 2 3 4 5 6 7 8 9 -4 -3 -2 -1 0 1 2 3 4 3. Interval: When measurements are made on a scale with equal intervals between points on the scale, but the scale has no true zero point. e.g. temperature on Celsius scale: 100 is water's boiling point; 0 is an arbitrary zero-point (when water freezes), not a true absence of temperature. Equal intervals represent equal amounts, but ratio statements are meaningless - e.g., 60 deg C is not twice as hot as 30 deg! Many measurements in psychology are interval data - e.g., IQ scores.
4. Ratio: When measurements are made on a scale with equal intervals between points on the scale, and the scale has a true zero point. e.g. height, weight, time, distance. Measurements in psychology which are ratio data include reaction times, number correct, error scores.
What kind of measurement is a Likert scale? Likert scales are often used to measure attitudes and opinions: How attractive is Simon Cowell? (1 = “highly unattractive”, 7 = “highly attractive”) Is this scale interval? Or ordinal? Strictly speaking, these are ordinal data – but commonly treated as interval measurements.
Nominal data masquerading as scale measurements: SPSS uses numbers as codes for nominal data. Here “1” = “male” and “2” = “female. These are names, not numbers!
Frequency distributions: 50 scores on a statistics exam (max = 100): 84 82 72 70 72 80 62 96 86 68 68 87 89 85 82 87 85 84 88 89 86 86 78 70 81 70 86 88 79 69 79 61 68 75 77 90 86 78 89 81 67 91 82 73 77 80 78 76 86 83
Raw (ungrouped) Frequency Distribution: Score Freq Score Freq Score Freq Score Freq 96 1 86 6 76 1 66 0 95 0 85 2 75 1 65 0 94 0 84 2 74 0 64 0 93 0 83 1 73 1 63 0 92 0 82 3 72 2 62 1 91 1 81 2 71 0 61 1 90 1 80 2 70 3 89 3 79 2 69 1 88 2 78 3 68 3 87 2 77 2 67 1
Relative Frequency Distributions: Useful for comparing groups with different totals. Relative frequency = (cell total/overall total) x 100
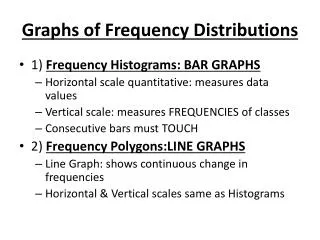
Raw Frequency and Relative Frequency Distributions: Only the scale of the graph changes - not the pattern of frequencies.
Effects of aspect ratio and scale on graph appearance: (a) A graph aimed at giving an accurate impression...
(d) Starting the scale at a value other than zero can also exaggerate apparent differences.
Graphing averages: If plotting averages, always include a measure of how scores are spread out around the average.