Download
1 / 14
150 likes | 454 Vues
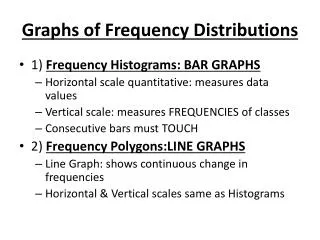
Graphs of Frequency Distributions. 1) Frequency Histograms: BAR GRAPHS Horizontal scale quantitative: measures data values Vertical scale: measures FREQUENCIES of classes Consecutive bars must TOUCH 2) Frequency Polygons:LINE GRAPHS Line Graph: shows continuous change in frequencies

E N D
Graphs of Frequency Distributions • 1) Frequency Histograms: BAR GRAPHS • Horizontal scale quantitative: measures data values • Vertical scale: measures FREQUENCIES of classes • Consecutive bars must TOUCH • 2) Frequency Polygons:LINE GRAPHS • Line Graph: shows continuous change in frequencies • Horizontal & Vertical scales same as Histograms
Class Boundaries • Used in HISTOGRAMS • 1) Find theUPPER limit of FIRST class and LOWER limit of second class • 2) Subtract these values (Usually 1) • 3) Divide by 2 (Usually .5) • 4) SUBTRACT this # from each lower limit and ADD this # to each upper limit: = boundaries
Frequency Distribution Histogram • Class Boundaries are widths of bars • Class Heights are the Frequencies of each class Internet usage Frequency # of subscribers
Frequency Distribution Polygons • Midpoints of classes are x-values :extend ends • Frequencies of classes are y-values: ends at 0 • Connect points (line graph) Frequency (# of subscribers) Time online in minutes (midpoints)
Example: Do Try it Yourself p. 35 # 3 & 4 (Use data on p. 29) • USE 6 Classes
Example: Do Try it Yourself p. 35 # 3 & 4 (Use data on p. 29) • USE 6 Classes - Width (63-0)/6=10.5 ≈ 11
Example: Do Try it Yourself p. 35 # 3 & 4 (Use data on p. 29) • USE 6 Classes - Width (63-0)/6=10.5 ≈ 11
Example: Do Try it Yourself p. 35 # 3 & 4 (Use data on p. 29) • USE 6 Classes - Width (63-0)/6=10.5 ≈ 11
Example: Do Try it Yourself p. 35 # 3 & 4 (Use data on p. 29) • USE 6 Classes - Width (63-0)/6=10.5 ≈ 11
Example: Do Try it Yourself p. 35 # 3 & 4 (Use data on p. 29) • USE 6 Classes - Width (63-0)/6=10.5 ≈ 11 77
Example: Do Try it Yourself p. 35 # 3 & 4 (Use data on p. 29) • USE 6 Classes - Width (63-0)/6=10.5 ≈ 11 77
Histogram Frequency 5 16 27 38 49 60
Frequency Polygon Frequency