Download
1 / 14
160 likes | 400 Vues
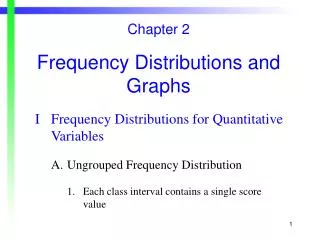
Section 2.1. Frequency Distributions and Their Graphs. Steps to Construct a Frequency Distribution. 1. Choose the number of classes. Should be between 5 and 15. 2. Calculate the Class Width.

E N D
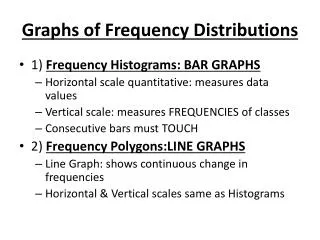
Section 2.1 Frequency Distributions and Their Graphs
Steps to Construct a Frequency Distribution 1. Choose the number of classes Should be between 5 and 15 2. Calculate the Class Width Find the range = maximum value – minimum. Then divide this by the number of classes. Finally, always round up to a whole number. 3. Determine Class Limits The lower class limit is the lowest data value that belongs in a class and the upper class limit it the highest. Use the minimum value as the lower class limit in the first class. 4. Mark a tally | in appropriate class for each datavalue. After all data values are tallied, count the tallies in each class for the class frequencies.
Making a Frequency Distribution Table The data set lists the number of minutes 15 students spent on the Internet last night. Construct a frequency distribution that has five classes. Frequency Distribution for InternetUsage (in minutes) 40 41 17 11 19 23 37 51 56 72 56 17
Constructing a Frequency Histogram Class Limits Tally f f =15 Boundaries 10.5 - 26.5 26.5 - 42.5 42.5 - 58.5 58.5 -74.5 74.5 -90.5 5 3 5 1 1 11 - 26 27 - 42 43 - 58 59 - 74 75 - 90 | | | | | | | | | | | | | You will need to construct a frequency distribution table and find the class boundaries (This is a new column in your frequency distribution table). Finding the class boundaries. Subtract 0.5 from the lower limit and add 0.5 to the upper limit. First class lower boundary = 11 - .05 = 10.5 First class upper boundary = 26 + .05 = 26.5
Frequency Histogram f Boundaries 10.5 - 26.5 26.5 - 42.5 42.5 - 58.5 58.5 -74.5 74.5 -90.5 5 3 5 1 1 5 5 5 4 3 3 f 2 1 1 1 0 10.5 26.5 42.5 58.5 74.5 90.5 CB • A frequency histogram is a bar graph that represents the frequency distribution of a • data set. A histogram has the following properties. • The horizontal scale measures the data value (The class boundaries). • The vertical scale measures the frequencies of the classes. • 3. Consecutive bars must touch.
Frequency Histogram using midpoints The frequency histogram on the previous page was constructed using the class boundaries. The same histogram can also be displayed using the midpoints of the class boundaries. 5 3 5 1 1 f Boundaries 10.5 - 26.5 26.5 - 42.5 42.5 - 58.5 58.5 -74.5 74.5 -90.5 Midpts 18.5 34.5 50.5 66.5 82.5 6 5 5 5 f 4 3 3 2 1 1 1 0 18.5 34.5 50.5 66.5 82.5 Midpoints
Definitions The midpointof a class is the sum of the lower and upper limits of the class divided by two (the average). It is sometimes called the class mark. Midpoint = (Lower class limit) + (Upper class limit) 2 The relative frequency of a class is the percent o f the data that falls in that class. To find it, divide the frequency f by the sample size n Relative frequency = Class frequency = f Sample size n The cumulative frequency of a class is the sum of the frequency for that class and all previous classes. The cumulative frequency of the last class is equal to the sample size n.
To construct a frequency polygon, use the same horizontal and vertical scales you would use in a histogram labeled with class midpoints. Then plot the points that represent the midpoint and frequency of each class and connect the points in order from left to right. Constructing a Frequency Polygon Mark the midpoint at the top of where each bar would be. Connect consecutive midpoints. Extend the frequency polygon to the axis. 5 3 5 1 1 Midpts 18.5 34.5 50.5 66.5 82.5 f 6 5 5 f 3 3 1 1 96.5 108.5 120.5 72.5 84.5 Midpoints
Lets make one together. Construct a frequency histogram using midpoints for the sample of 20 adult females reaction times to an auditory stimulus. Use 5 classes.507 389 305 318 336 310 504 442 307 337 428 387 454 323 441 388 426 469 351 411 You try it. Use 5 classes. 33 45 34 47 43 48 35 69 45 60 46 51
Class LimitsTallyf Midpoint f =15 f / n = 1 Relative Frequency Cumulative Frequency 5 3 5 1 1 11 – 26 27 – 42 43 – 58 59 – 74 75 - 90 | | | | | | | | | | | | |
Try It Yourself 1 Contract a frequency distribution using the ages of the 77 residents of Akhiok, Alaska. Use 6 classes. 28 6 17 48 63 47 27 21 3 7 12 39 50 • 33 45 15 24 1 7 36 53 46 27 5 32 • 52 11 42 22 3 17 34 56 25 2 30 33 1 49 13 16 8 31 21 6 9 2 11 32 25 0 55 23 41 29 4 51 1 6 31 5 5 11 4 10 26 12 6 16 8 2 4 28 32 26
Constructing a Relative Frequency Histogram A relativefrequency histogram is similar to a frequency histogram; but instead of using the frequency along the horizontal scale, you use the relative frequency. Relative Freq. 0.33 0.20 0.33 0.07 0.07 Boundaries 10.5 - 26.5 26.5 - 42.5 42.5 - 58.5 58.5 -74.5 74.5 -90.5 5 3 5 1 1 f
15 Cumulative Frequency 10 5 0 10.5 26.5 42.5 58.5 74.5 90.5 Ogive An ogive reports the number of values in the data set that are less than or equal to the given value, x. (Used with the cumulative frequency) Boundaries 10.5 - 26.5 26.5 - 42.5 42.5 - 58.5 58.5 -74.5 74.5 -90.5 15 C.F. 14 5 8 13 14 15 13 8 5 0 Class Bounds.
Use the data below to create a frequency polygon, relative frequency histogram, and ogive graph. Use 5 classes • 15 24 36 53 46 • 52 11 42 22 9 17