Frequency Distributions and Graphs
Chapter 2:. Frequency Distributions and Graphs. Section 1 – Organizing Data. Learning Target - I will be able to organize data using a frequency distribution. Frequency Distribution. The organization of raw data in table form, using classes and frequencies.


Frequency Distributions and Graphs
E N D
Presentation Transcript
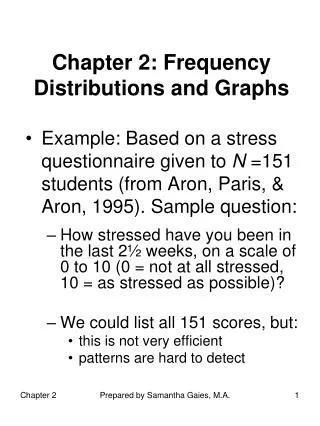
Chapter 2: Frequency Distributions and Graphs
Section 1 – Organizing Data Learning Target - I will be able to organize data using a frequency distribution.
Frequency Distribution • The organization of raw data in table form, using classes and frequencies. • Class – a qualitative or quantitative category • Frequency – the number of data values contained in a specific class
Categorical Frequency Distribution • Used for data that can be placed in specific categories such as nominal and ordinal level data
Example: Raw Data – Blood Types Steps to Make a Categorical Frequency Distribution • Step 1: Make a Table
Steps continued • Step 2: Tally the data • Step 3: Count the tallies and place results under frequencies. • Step 4: Find the percentage of each value by using the following formula • % = f/n x 100% • Step 5: Find the totals for the frequency and percent column.
Grouped Frequency Distribution • Use when the range of data is large and must be grouped into classes that are more than one unit in width
Vocabulary for Grouped Frequency Distributions • Class Limits • Lower class limits – the smallest data value that can be included in the class • Upper class limits – the largest data value that can be included in the class • Class Boundaries – numbers to separate the classes so there are no gaps • Class Width – subtract the lower class limit of the first class from the lower class limit of the second class
Steps to Make a Grouped Frequency Distribution • Step 1: Determine the classes • Find the highest and lowest values • Find the range • Select number of classes desired (5 – 20) • Find the width by dividing the range by the number of classes and rounding up • Select a starting point (usually the lowest value or any convenient number less than the lowest value); add the width to get the lower limits • Find the upper class limits • Find the boundaries
Steps (cont’) • Step 2: Tally the data • Step 3: Find the numerical frequencies from the tallies, and find the cumulative frequencies
Reasons for constructing • To organize the data in a meaningful, intelligible way. • To enable the reader to determine the nature or shape of the distribution • To facilitate computational procedures for measures of average and spread 4. To enable the researcher to draw charts and graphs for the presentation of data. 5. To enable the reader to make comparisons among different data sets.
Section 2-2 Histograms, Frequency Polygons, and Ogives
Learning Target • I will be able to represent data in a frequency distribution graphically using histograms, frequency polygons, and ogives.
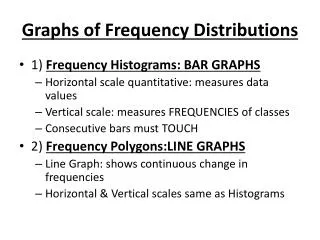
Histograms • A graph that displays data with contiguous (touching) vertical bars of various heights to represent the frequencies of the classes.
Histograms (cont’) How to create a histogram Step 1: Draw and label the x and y axes. Step 2: Represent the frequency on the y-axis and class boundaries on the x-axis. Give the graph a title. Step 3: Using the frequencies as heights, draw vertical bars for each class.
Frequency Polygons • A graph that displays the data by using lines that connect the points plotted for the frequencies at the midpoint of the classes
Steps to Create a Frequency Polygon • Step 1: Find the midpoints of each class • Add the upper and lower boundaries and divide the sum by 2. • Step 2: Draw the x and y axes. Label the x with the midpoint and use a suitable scale on the y axis for the frequency. • Step 3: Using the midpoints for the x values and the frequencies as y values, plot the points.
Steps (cont’) • Step 4: Connect adjacent points with line segments. Draw a line back to the x axis at the beginning and end of the graph, at the same distance that the previous and next midpoints would be located. • To do this, add a class to the beginning and end of the frequency distribution with a frequency of zero for both.
A histogram and frequency polygon are two ways to represent the same data set. The choice of which one to use is up to the researcher.
Ogive – (pronounced ojive) • A line graph that represents the cumulative frequencies for the classes in a frequency distribution. • Cumulative frequency – the sum of the frequencies accumulated up to the upper boundary of a class in the distribution.
Steps to Create Ogives • Step 1: Find the cumulative frequency for each class. • Add each frequency one at a time so that the last class has the total. • Step 2: Draw the x and y axes. Label the x axis with the class boundaries. Use an appropriate scale for the y axis to represent the cumulative frequencies.
Steps (cont’) • Step 3: Plot the cumulative frequency at each upper class boundary. • Step 4: Starting with the first upper class boundary connect adjacent points with line segments. Extend the graph to the first lower class boundary on the x axis.
Cumulative frequency graphs are used to visually show how many values are below a certain upper class boundary. • To find how many values are less than a specific boundary, draw a vertical line up to the graph and then a horizontal line to the y axis.
Relative Frequency Graphs • Histograms, frequency polygons and ogives that use proportions of the raw data. • To find the proportion, divide the frequency by the total items. • The cumulative relative frequency will always add to one.
Section 2-3 Other Types of Graphs
Bar Graphs • Represent the data by using vertical or horizontal bars, whose heights and lengths represent the frequencies of the data
How to create bar graph • Draw and label x and y axes. • Horizontal – frequency goes on the x axis, categories go on the y axis • Vertical – frequency goes on the y axis, categories go on the x axis • Draw the bars corresponding to the frequencies.
Pareto Charts • Represent a frequency distribution for a categorical variable, and the frequencies are displayed by the heights of vertical bars, which are arranged in order from highest to lowest
How to create a Pareto Chart • Arrange the data from highest to lowest according to frequency. • Draw and label the x and y axes. The x axis is the category and the y axis is the frequency. • Draw the bars corresponding to the frequencies. Make sure the bars are touching.
Time Series Graph • Represents data that occur over a specific period of time
How to create a Time Series Graph • Draw and label the x and y axes. The x axis is the time and the y axis is the data. • Plot each point from the table. • Draw a line connecting the points. The line does not have to be a smooth curve or straight line, just connect the dots.
Pie Graph • A circle that is divided into sections or wedges according to the percentage of frequencies in each category of the distribution.
How to create a Pie Graph • Since there are 360 degrees in a circle, the frequency for each class must be converted into a proportional part of the circle. This is done by using the formula where f is the frequency and n is the sum of the frequencies. • Convert each frequency to a percentage by using the formula
Steps continued 3. Use a protractor and a compass to draw the graph using the appropriate degree measures and label the sections with the name and percentages of each category