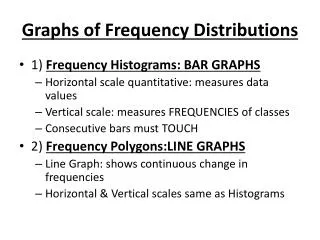
Frequency Distributions and Graphs
Descriptive Statistics. Frequency Distributions and Graphs. Introduction. Data must be organized Frequency distribution Present data Statistical graphs and charts. Organizing Data. Frequency distribution Uses classes and frequency 3 types Categorical frequency distribution

Frequency Distributions and Graphs
E N D
Presentation Transcript
Descriptive Statistics Frequency Distributions and Graphs
Introduction • Data must be organized • Frequency distribution • Present data • Statistical graphs and charts
Organizing Data • Frequency distribution • Uses classes and frequency • 3 types • Categorical frequency distribution • Nominal - or ordinal- type data • Ungrouped frequency distribution • Grouped frequency distribution
Construct a Categorical Distribution • Make a table • Class Tally Frequency Percent • Tally the data • Count the tallies – frequency • Find the percentage • % = f/n * 100 • f – frequency • n – total number
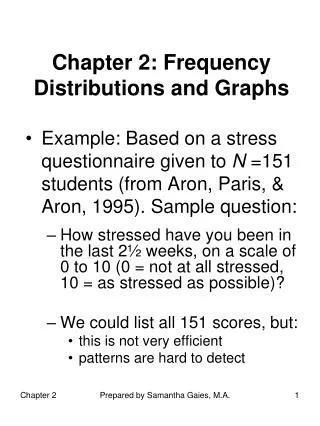
Example 2-1 Twenty-five army inductees were given a blood test to determine their blood type. Construct a frequency distribution for the data. • Step 1: Make a table • Step 2: Tally the data • Step 3: Count the tallies • Step4: Find the percentage of values in each class
Ungrouped Frequency Distribution • Range of data is relatively small • Range = highest value – lowest value • Single data values for each class • Steps similar to categorical distribution • Make a table • Each unique data value is a class • Tally - Frequency • Percent or Relative Frequency • Rel. freq. = # of ea. value/ total # of values
Example A survey was taken on Maple Avenue. In each of 20 homes, people were asked how many cars were registered to their households. The results were recorded as follows: 1, 2, 1, 0, 3, 4, 0, 1, 1, 1, 2, 2, 3, 2, 3, 2, 1, 4, 0, 0 Construct a frequency distribution for the data.
Solution Step 1: Make a table # of cars tally frequency rel. freq. Step 2: Tally – Frequency Step 3: Percent or Rel. Freq.
Grouped Frequency Distribution • Range of data is large • Classes are more than 1 unit in width • Vocabulary • Class width – difference between consecutive lower class limits or upper class limits • 31 – 24 = 7 • 37 – 30 = 7 Lower class limits Upper class limits
Grouped Frequency Distribution • Class boundaries • Always end in a 5 • 1 decimal place to right of data • If data are whole numbers • - 0.5 from lower limit • + 0.5 to upper limit • Class limits should have the same # of dec. places as the data -0.5 +0.5
Guidelines for Classes • There should be between 5 and 20 classes • Class width should be an odd number • Midpoints will be integers instead of decimals • Classes must be mutually exclusive • No data value can fall into 2 classes • Classes must be continuous • No gaps • Even if there is no data in a class it must be included • Classes are exhaustive • All data fits into a class • Classes are equal in width • Only exception open-ended class
Constructing a grouped freq. distribution • Determine the number of classes • Find the highest and lowest values • Find the range • Select the # of classes (5 – 20) • Find the width • w = range/# of classes • Round up • 3.2 becomes 4 • 3 becomes 4 • Choose the lowest value as your starting point • Add the class width to this lower limit • Continue adding the width to the lower limits until you get the rest of the lower limits • Find the first upper limit • Subtract 1 from the second lower limit • Continue adding the width to find the remaining upper limits
Example 2-2 - done in parts These data represent the record high temperatures for each of the 50 states. Construct a grouped frequency distribution for the data using 7 classes. 112 100 127 120 134 118 105 110 109 112 110 118 117 116 118 122 114 114 105 109 107 112 114 115 118 117 118 122 106 110 116 108 110 121 113 120 119 111 104 111 120 113 120 117 105 110 118 112 114 114
Class limits Determine the # of classes Find the highest and lowest values H = 134 L = 100 Find the range: H – L ; R = 134 – 100 = 34 Select # of classes (already asks for 7) Find the class width: w = R/7; w = 34/7 = 4.9 ~ 5 Choose a starting point – lowest value = 100 Add the class width to find next lower limit Continue adding the width until there are 7 Find the first upper limit – subtract 1 from the second lower limit 105 – 1 = 104 Add the width to the upper limits + 5 + 5 + 5 + 5 + 5 + 5 + 5 + 5 + 5 + 5 + 5 + 5
Class boundaries &Class midpoints Class midpoints determined by adding the 2 class limits together then dividing by 2 Or Adding the 2 class boundaries together then dividing by 2 100 + 104 = 204/2 = 102 - .5 + .5
Constructing a grouped freq. distribution • Tally the data • Find the numerical frequencies from the tallies • Find the cumulative frequencies + + + + + +