Download
1 / 48
480 likes | 504 Vues
Explore various sources of uncertainty in global climate projections, from physical processes to emissions scenarios, and their impacts. Learn about the importance of feedbacks and the time dependence of climate responses.

E N D
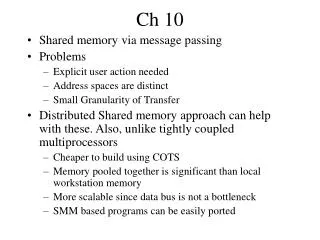
Ch. 10 Global Climate Projections Li Jian Erik Swenson Youkyoung Jang
Equilibrium Climate Sensitivity Response after equilibrium is reached Indication of model feedbacks Transient Climate Response (TCR) 1% yr-1 increase for 100 yrs Result at time of doubling TCR < Equilibrium Ocean heat uptake causes lag in warming Globally averaged Tsfc (air) after CO2 doubling Fig. 10.25a
PDFs from Constraints • likely range: TAR 1.50C to 4.50C AR4 2.00C to 4.50C • PDfs more robust Box 10.2
Uncertainty from Internal Variability • Initial value problem • Chaos due to nonlinearity of dynamical system • Considered by taking ensembles within each model
Uncertainty with Emissions • Dependent on important socioeconomic drivers, technological development, and political decisions • Not addressed in AR4 • 6 SRES scenarios span different emission futures • Assume no mitigation, but wide variation • considered equally probable • Further uncertainty quantified after assuming a particular scenario will occur
Uncertainty with Physical Processes • Parameterization schemes • Ocean heat uptake / vertical mixing • Aerosol forcing • Clouds / precipitation • Multi-model ensembles attempt to sample all options • Individual studies play around with parameters • Water vapor feedback • Influences CH4 projections • Carbon cycle feedback (tune EMIC to AOGCM)
* * * Fig. 10.26
* * * Fig. 10.26
Projections have more agreement first few decades (models & scenarios) Over a longer time scale feedbacks become more important more uncertainty Time Dependence Fig. 10.28
Atmospheric concentration depends on sources and sinks CO2 removal processes have multiple time scales (undefined lifetime) Emissions Commitment CO2 120 yrs lifetime 12 yrs FAQ 10.3, Fig. 1
Projected Changes • Multi-model data set • 1% increase • equilibrium 2 x • 2 x , 4 x atmospheric in the 1% • - change of emission in models --> radiative forcing change • --> climate response (temperature, precipitation, atmospheric • circulation)
Radiative forcing Change during 2000 ~ 2100 Long wave forcing Short wave forcing
Instantaneous radiative forcing and flux change in vertical Doubling in atmosphere --> specific humidity increase Flux
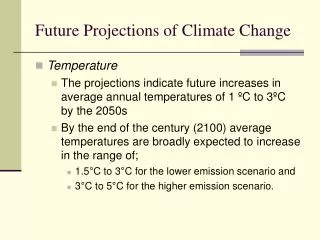
Projected Change: Physical Climate System A2(high), A1B(medium), B1(low) : prescribed concentrations and resulting forcing relative to the SRES range
Projected Change: Physical Climate System Temperature Precipitation
Patterns of Change in 21st century: zonal mean (2080~2099 relative to 1980~1999)
Patterns of Change: mean change for 2080~2099 from 1980~1999
Patterns of Change : cloud fraction (important link to humidity and precipitation) A1B: 2080~2099 Relative to 1980~1999
Patterns of Change: Precipitation and surface water Annual mean, A1B: 2080~2099 relative to 1980~1999
Changes in Meridional Overturning circulation In high latitude: temperature and precipitation increase --> less dense water --> stable ocean --> inhibit convective process
Changes in Atlantic meridional overturning circulation 1850~1999: 20th century climate in Coupled Model(20C3M) 1999~2100: SRES A1B emission scenario ~2200: forcing held constant at the values of year 2100
3.6 weather and climate extremes • Precipitation extreme • Increased risk of drought (drought areas increase from 1% to 30% in A2) • Increased chance of intense precipitation and flooding • Temperature extreme • Raise probability of extreme warm seasons • Decline the frequency of cold air outbreaks in NH winter • Hurricanes and storms • Coarse resolution models :: more intense precipitation • High resolution models :: increase in peak wind speed and precipitation intensity, might globally decrease frequency • Polarward shift of storm track
4.1 carbon cycle and vegetation feedback • Coupled climate-carbon cycle model intercomparison project (C4MIP, 11 models) • Results: Climate change will reduce the efficiency of land and ocean to absorb CO2 • Positive feedback • CO2>Warm>Decrease absorption>CO2>warm….. • Two extreme models • CO2 concentration +20ppm +220ppm • Radiative forcing +0.1 W/m-2 +1.3W/m-2 • Temperature +0.1 oC +1.5 oC
1020 ppm SRES A2 emission scenario Figure 10.20 836 ppm 730 ppm C4MIP :: 2.4~5.6 oC AR4 :: 2.6~ 4.1 oC
Goal Simulation w/o coupled climate carbon cycle Simulation w/ coupled climate carbon cycle Reduce more CO2 emission
4.2 Ocean acidification • Increasing CO2 lower ocean pH • By 2100, ocean pH is projected to decrease 0.3~0.4 unit. Affect ecosystem. (muti-model) • Deep ocean chemistry structure
Figure 10.23.Multi-model median for projected levels of saturation (%) with respect to aragonite, a meta-stable form of calcium carbonate, over the 21st century from the Ocean Carbon-Cycle Model Intercomparison Project (OCMIP-2) models (adapted from Orr et al., 2005). Calcium carbonate dissolves at levels below 100%. Surface maps (left) and combined Pacific/Atlantic zonal mean sections (right) are given for scenario IS92a as averages over three time periods: 2011 to 2030 (top), 2045 to 2065 (middle) and 2080 to 2099 (bottom). Atmospheric CO2 concentrations for these three periods average 440, 570 and 730 ppm, respectively. Latitude-depth sections start in the North Pacific (at the left border), extend to the Southern Ocean Pacific section and return through the Southern Ocean Atlantic section to the North Atlantic (right border). At 100%, waters are saturated (solid black line - the aragonite saturation horizon); values larger than 100% indicate super-saturation; values lower than 100% indicate undersaturation. The observation-based (Global Ocean Data Analysis Project; GLODAP) 1994 saturation horizon (solid white line) is also shown to illustrate the projected changes in the saturation horizon compared to the present.
Figure 10.24.Changes in global average surface pH and saturation state with respect to aragonite in the Southern Ocean under various SRES scenarios. Time series of (a) atmospheric CO2 for the six illustrative SRES scenarios, (b) projected global average surface pH and (c) projected average saturation state in the Southern Ocean from the BERN2.5D EMIC (Plattner et al., 2001). The results for the SRES scenarios A1T and A2 are similar to those for the non-SRES scenarios S650 and IS92a, respectively. Modified from Orr et al. (2005).
4.3 Future evolution of ozone • Coupled chemistry-climate models • Trend in upper-stratospheric ozone changes sign between 2000 and 2005 • Anthropogenic activity, • Climate conditions, • Stratosphere-troposphere exchange • Troposphere ozone increase throughout 21st century • +20~25% from 2015~2050 (Grewe et al. 2001) • +40~60% at 2100 (Stevenson et al. 2001) • Ozone increases are largest in the tropics and subtropics
4.4 Aerosol species • Of 23 models for IPCC AR4 • 13 include aerosol species • 7 have non-sulphate species interact with other physics • 2 models treat Nitrates • Black and organic carbon :: highly simplified bulk parametrizations • Interaction of soil dust is under active investigation • Uncertainty also come from unpredictable natural forcing such as volcanic eruptions and solar variability
6.1 sea level rise due to thermal expansion • Calculated from ocean temp. • 17 models results available
Figure 10.31.Projected global average sea level rise (m) due to thermal expansion during the 21st century relative to 1980 to 1999 under SRES scenarios A1B, A2 and B1. See Table 8.1 for model descriptions.
6.2 local change due to density and dynamics • Dynamic topography <-- local T & S & circulation • 16 models (A1B) • Spatial patterns are different among models
Figure 10.32.Local sea level change (m) due to ocean density and circulation change relative to the global average (i.e., positive values indicate greater local sea level change than global) during the 21st century, calculated as the difference between averages for 2080 to 2099 and 1980 to 1999, as an ensemble mean over 16 AOGCMs forced with the SRES A1B scenario. Stippling denotes regions where the magnitude of the multi-model ensemble mean divided by the multi-model standard deviation exceeds 1.0.
6.3 Glaciers and ice caps • Mass balance sensitivity to T and P • Under A1B A2 and B1 -> 0.61mm/yr or 0.49mm/yr • Required increase P 20~50%/oC 29~41%/oC • Dynamic response and feedback • Volume lost-- area decline -- ablation decrease • Glacier and IC on Greenland and Antarctic • 10~20% sea level rise contribution of G&IC in future decades
6.4 Ice sheet • Surface mass balance (SMB) • Increase in accumulation • Antarctic SMB changes will contribute negatively to sea level • Greenland SMB represents a net positive contribution to sea level
EMICs A1B before 2100 Constant composition 2100-3000 Tsfc stabilizes relatively quickly Sea level continues to rise MOC shutdown?! Long Term Commitment Fig. 10.34
Path to CO2 stabilization at 750 ppm before 2100 Zero emissions 2100-3000 Model dependence Notice carbon redistribution Long Term Commitment Fig. 10.35
Greenland Ice Sheet • Threshold for surface mass balance (SMB) of Greenland ice is 3.20 C - 6.20 C warming • Global average of 1.90 C - 4.60 C • Likely to be reached with A1B to 2100 • Under constant 4*CO2, half of ice gone in ~1000 yrs • With less ice, Greenland’s climate is warmer (albedo feedback) IRREVERSIBLE? Fig. 10.38
www.seacoastnrg.org/img/usgs_antarctica.jpg Antarctic Ice Sheet • Growing as a whole • Concern is West Antarctic ice shelves breaking off • Base melt rate water T near base • Entire sheet 5m sea level rise! • “We are not able to relate this quantitatively to global warming with any confidence …” • May explain some part of sea level rise for last interglacial (4-6m)