LINEAR PROGRAMMING
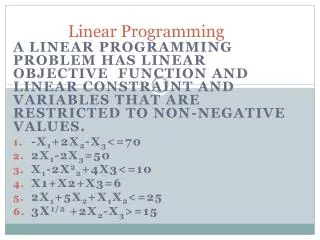
LINEAR PROGRAMMING. FORMULATION AND GRAPHIC METHOD. DEFINITION. Mathematical technique for optimizing the use of constrained resources, where the relationship between variables is linear. Historical Perspective. 1928 – John von Neumann published related central theorem of game theory.

LINEAR PROGRAMMING
E N D
Presentation Transcript
LINEAR PROGRAMMING FORMULATION AND GRAPHIC METHOD
DEFINITION • Mathematical technique for optimizing the use of constrained resources, where the relationship between variables is linear.
Historical Perspective 1928 – John von Neumann published related central theorem of game theory. 1944 – Von Neumann and Morgenstern published Theory of Games and Economic Behavior. 1936 – W.W. Leontief published "Quantitative Input and Output Relations in the Economic Systems of the US” which was a linear model without objective function. 1939 – Kantoravich (Russia) actually formulated and solved a LP problem. 1941 – Hitchcock poses transportation problem (special LP) WWII – Allied forces formulate and solve several LP problems related to military. A breakthrough occurred in 1947...
SCOOP • US Air Force wanted to investigate the feasibility of applying mathematical techniques to military budgeting and planning. • George Dantzig had proposed that interrelations between activities of a large organization can be viewed as a LP model and that the optimal program (solution) can be obtained by minimizing a (single) linear objective function. • Air Force initiated project SCOOP (Scientific Computing of Optimum Programs) NOTE: SCOOP began in June 1947 and at the end of the same summer, Dantzig and associates had developed: 1) An initial mathematical model of the general linear programming problem. 2) A general method of solution called the simplex method.
Simplex Today • A large variety of Simplex-based algorithms exist to solve LP problems. • Other (polynomial time) algorithms have been developed for solving LP problems: • Khachian algorithm (1979) • Kamarkar algorithm (AT&T Bell Labs, mid 80s) BUT none of these algorithms have been able to beat Simplex in actual practical applications. HENCE Simplex (in its various forms) is and will most likely remain the most dominant LP algorithm for at least the near future
Linear – relationship between two or more variables which is directly and precisely proportional.Programming – refers to use of certain mathematical techniques to get the best possible solution to a given problem involving limited resources.
Basic Requirements • Decision variables and their relationships should be linear. • Objective function should be well defined • Presence of Constraints • Alternative course of action • Non negative restrictions • Linearity: Both Objective and Constraints must be expressed in Linear equations/inequalities.
Terminology • Decision variables – variables directly under the control of decision maker. • Objective function – An expression showing relationship between decision variables and organization's objectives. • Constraints – Limit or restriction on the availability of resources. • Non – negativity constraint – The decision variables must not assume negative values which is impossible situation. • Feasible region – The region which is common to all the constraints of given LPP.
Basic Solution – A solution of basic variables, where the values of non-basic variables are zero. • Feasible Solution – A solution satisfying all constraints and non-negativity restriction of a LPP. • Basic Feasible Solution – A basic solution, where the values of basic variables are non-negative. • Optimal Solution – A basic feasible solution which also optimizes the objective function.
Assumptions • Proportionality: • Proportionality/Linearity exists in Objective and Constraints • Additivity: • Total resources used must equal sum of resources used in individual activity • Divisibility: • Solution need not be whole numbers and may take up fractional value. • Certainty: • Co-efficients are known (Deterministic) • Finiteness: • Finite number of alternative solutions
Applications of LPP • Industry • Product Mix • Production Smoothing • Blending • Production Scheduling • Trim Loss • Miscellaneous • Diet Problems • Farm Planning • Airline Routing • Facility Location • Management • Portfolio Selection • Financial Mix • Media Selection • Manpower Planning • Transportation • Job Allocation • Travelling Salesman
Problem Formulation • Problem formulation or modeling is the process of translating a verbal statement of a problem into a mathematical statement.
LP Model Formulation Max/min z = c1x1 + c2x2 + ... + cnxn subject to: a11x1 + a12x2 + ... + a1nxn (≤, =, ≥) b1 a21x1 + a22x2 + ... + a2nxn (≤, =, ≥) b2 : am1x1 + am2x2 + ... + amnxn (≤, =, ≥) bm xj = decision variables bi = constraint levels cj = objective function coefficients aij = constraint coefficients
The Linear Programming Model (1) Let: X1, X2, X3, ………, Xn = decision variables Z = Objective function or linear function Requirement: Maximization of the linear function Z. Z = c1X1 + c2X2 + c3X3 + ………+ cnXn subject to the following constraints: …..Eq (2) where aij, bi, and cj are given constants.
The Linear Programming Model (2) • The linear programming model can be written in more efficient notation as: …..Eq (3) The decision variables, xI, x2, ..., xn, represent levels of ncompeting activities.
Examples of LP Problems (1) 1. A Product Mix Problem • A manufacturer has fixed amounts of different resources such as raw material, labor, and equipment. • These resources can be combined to produce any one of several different products. • The quantity of the ith resource required to produce one unit of the jthproduct is known. • The decision maker wishes to produce the combination of products that will maximize total income.
Examples of LP Problems (2) 2. A Blending Problem • Blending problems refer to situations in which a number of components (or commodities) are mixed together to yield one or more products. • Typically, different commodities are to be purchased. Each commodity has known characteristics and costs. • The problem is to determine how much of each commodity should be purchased and blended with the rest so that the characteristics of the mixture lie within specified bounds and the total cost is minimized.
Examples of LP Problems (3) 3. A Production Scheduling Problem • A manufacturer knows that he must supply a given number of items of a certain product each month for the next n months. • They can be produced either in regular time, subject to a maximum each month, or in overtime. The cost of producing an item during overtime is greater than during regular time. A storage cost is associated with each item not sold at the end of the month. • The problem is to determine the production schedule that minimizes the sum of production and storage costs.
Examples of LP Problems (4) 4. A Transportation Problem • A product is to be shipped in the amounts al, a2, ..., amfrom m shipping origins and received in amounts bl, b2, ..., bnat each of n shipping destinations. • The cost of shipping a unit from the ith origin to the jthdestination is known for all combinations of origins and destinations. • The problem is to determine the amount to be shipped from each origin to each destination such that the total cost of transportation is a minimum.
Examples of LP Problems (5) 5. A Flow Capacity Problem • One or more commodities (e.g., traffic, water, information, cash, etc.) are flowing from one point to another through a network whose branches have various constraints and flow capacities. • The direction of flow in each branch and the capacity of each branch are known. • The problem is to determine the maximum flow, or capacity of the network.
Developing LP Model (1) • The variety of situations to which linear programming has been applied ranges from agriculture to zinc smelting. • Steps Involved: • Determine the objective of the problem and describe it by a criterion function in terms of the decision variables. • Find out the constraints. • Do the analysis which should lead to the selection of values for the decision variables that optimize the criterion function while satisfying all the constraints imposed on the problem.
Guidelines for Model Formulation • Understand the problem thoroughly. • Describe the objective. • Describe each constraint. • Define the decision variables. • Write the objective in terms of the decision variables. • Write the constraints in terms of the decision variables.
Formulating LP Problems • One of the most common LP applications is the product mix problem • Two or more products are produced using limited resources such as personnel, machines, and raw materials • The profit that the firm seeks to maximize is based on the profit contribution per unit of each product • The company would like to determine how many units of each product it should produce so as to maximize overall profit given its limited resources
Flair Furniture Company • The Flair Furniture Company produces inexpensive tables and chairs • Processes are similar in that both require a certain amount of hours of carpentry work and in the painting and varnishing department • Each table takes 4 hours of carpentry and 2 hours of painting and varnishing • Each chair requires 3 of carpentry and 1 hour of painting and varnishing • There are 240 hours of carpentry time available and 100 hours of painting and varnishing • Each table yields a profit of $70 and each chair a profit of $50
Flair Furniture Company • The company wants to determine the best combination of tables and chairs to produce to reach the maximum profit
Flair Furniture Company • The objective is to Maximize profit • The constraints are • The hours of carpentry time used cannot exceed 240 hours per week • The hours of painting and varnishing time used cannot exceed 100 hours per week • The decision variables representing the actual decisions we will make are T = number of tables to be produced per week C = number of chairs to be produced per week
Flair Furniture Company • We create the LP objective function in terms of T and C Maximize profit = $70T + $50C • Develop mathematical relationships for the two constraints • For carpentry, total time used is (4 hours per table)(Number of tables produced)+ (3 hours per chair)(Number of chairs produced) • We know that Carpentry time used ≤ Carpentry time available 4T + 3C ≤ 240 (hours of carpentry time)
Flair Furniture Company • Similarly Painting and varnishing time used ≤ Painting and varnishing time available 2 T + 1C ≤ 100 (hours of painting and varnishing time) This means that each table produced requires two hours of painting and varnishing time • Both of these constraints restrict production capacity and affect total profit
subject to 4T+ 3C ≤ 240 (carpentry constraint) 2T + 1C ≤ 100 (painting and varnishing constraint) T, C≥ 0 (nonnegativity constraint) Flair Furniture Company • The values for T and C must be nonnegative T≥ 0 (number of tables produced is greater than or equal to 0) C≥ 0 (number of chairs produced is greater than or equal to 0) • The complete problem stated mathematically Maximize profit = $70T + $50C
Linear Programming Problem • A firm producing 2 products P1 and P2. Each unit of P1 requires 1 kg material A, 2 kg of material B and 1 unit of labor. Each unit of P2 requires 3 kg of material B and 1 unit of labor. Each week firm has availability of 6 kg of material A, 19 kg of material B and 8 units of labor. One unit of P1 sold earn profit of Rs. 5 and P2 earns profit of Rs 7. How many units of each product is to be produced so as to give the maximum profit.
A Maximization Problem • LP Formulation Max Z = 5x1 + 7x2 (Profit function) s.t. x1< 6 (MaterialAConstraint) 2x1 + 3x2< 19 (MaterialBConstraint) x1 + x2< 8 (Labor Constraint) x1, x2> 0 (Non-negativity constraint)
Graphic Method of solving LPP • Formulate linear programming problem. • Each inequality in the constraints may be written as equality. • Plot the constraint lines considering them as equations. • Identify the feasible solution region. • Locate the corner points of the feasible region. • Calculate the value of objective function on the corner points. • Choose the point where the objective function has optimal value.
Graphical Solution x2 • Constraint #1 Graphed 8 7 6 5 4 3 2 1 1 2 3 4 5 6 7 8 9 10 x1< 6 (6, 0) x1
Graphical Solution x2 • Constraint #2 Graphed 8 7 6 5 4 3 2 1 1 2 3 4 5 6 7 8 9 10 (0, 6 1/3) 2x1 + 3x2< 19 (9 1/2, 0) x1
Graphical Solution x2 • Constraint #3 Graphed (0, 8) 8 7 6 5 4 3 2 1 1 2 3 4 5 6 7 8 9 10 x1 + x2< 8 (8, 0) x1
Graphical Solution x2 • Combined-Constraint Graph x1 + x2< 8 8 7 6 5 4 3 2 1 1 2 3 4 5 6 7 8 9 10 x1< 6 2x1 + 3x2< 19 x1
Graphical Solution x2 • Feasible Solution Region 8 7 6 5 4 3 2 1 1 2 3 4 5 6 7 8 9 10 Feasible Region x1
Example 1: Graphical Solution x2 • The Five Extreme Points 8 7 6 5 4 3 2 1 1 2 3 4 5 6 7 8 9 10 A B Feasible Region C E D x1
Evaluation of objective function at feasible region corner points Since Z has maximum value at point B (5,3), so x1 = 5, x2 = 3 Where profit is Rs 46.
Alternate Solution by extreme points x2 • Objective Function Line 8 7 6 5 4 3 2 1 1 2 3 4 5 6 7 8 9 10 (0, 5) Objective Function 5x1 + 7x2 = 35 (7, 0) x1
Alternate Graphical Solution x2 • Optimal Solution Objective Function 5x1 + 7x2 = 46 8 7 6 5 4 3 2 1 1 2 3 4 5 6 7 8 9 10 Optimal Solution (x1 = 5, x2 = 3) x1
Extreme Points and the Optimal Solution • The corners or vertices of the feasible region are referred to as the extreme points. • An optimal solution to an LP problem can be found at an extreme point of the feasible region. • When looking for the optimal solution, you do not have to evaluate all feasible solution points. • You have to consider only the extreme points of the feasible region.
Summary of the Graphical Solution Procedure for Maximization Problems • Prepare a graph of the feasible solutions for each of the constraints. • Determine the feasible region that satisfies all the constraints simultaneously. • Draw an objective function line. • Move parallel objective function lines toward larger objective function values without entirely leaving the feasible region. • Any feasible solution on the objective function line with the largest value is an optimal solution.
Minimization Problem Min Z = 5x1 + 2x2 Subject to constraints 2x1 + 5x2> 10 4x1 - x2> 12 x1 + x2> 4 x1, x2> 0
Graphical Solution • Graph the Constraints Constraint 1: When x1 = 0, then x2 = 2; when x2 = 0, then x1 = 5. Connect (5,0) and (0,2). The ">" side is above this line. Constraint 2: When x2 = 0, then x1 = 3. But setting x1 to 0 will yield x2 = -12, which is not on the graph. Thus, to get a second point on this line, set x1 to any number larger than 3 and solve for x2: when x1 = 5, then x2 = 8. Connect (3,0) and (5,8). The ">" side is to the right. Constraint 3: When x1 = 0, then x2 = 4; when x2 = 0, then x1 = 4. Connect (4,0) and (0,4). The ">" side is above this line.
Graphical Solution • Constraints Graphed x2 Feasible Region 5 4 3 2 1 4x1 - x2> 12 x1 + x2> 4 2x1 + 5x2> 10 1 2 3 4 5 6 x1
Graphical Solution • Graph the Objective Function Set the objective function equal to an arbitrary constant (say 20) and graph it. For 5x1 + 2x2 = 20, when x1 = 0, then x2 = 10; when x2= 0, then x1 = 4. Connect (4,0) and (0,10). • Move the Objective Function Line Toward Optimality Move it in the direction which lowers its value (down), since we are minimizing, until it touches the last point of the feasible region, determined by the last two constraints.
Graphical Solution Min z = 5x1 + 2x2 4x1 - x2> 12 x1 + x2> 4 • Objective Function Graphed x2 5 4 3 2 1 2x1 + 5x2> 10 1 2 3 4 5 6 x1
Graphical Solution • Solve for the Extreme Point at the Intersection of the Two Binding Constraints 4x1 - x2 = 12 x1+ x2 = 4 Adding these two equations gives: 5x1 = 16 or x1 = 16/5. Substituting this into x1 + x2 = 4 gives: x2 = 4/5
Solve for the Optimal Value of the Objective Function Solve for z = 5x1 + 2x2 = 5(16/5) + 2(4/5) = 88/5. Thus the optimal solution is x1 = 16/5; x2 = 4/5; z = 88/5