A Graphical Investigation of Some Microarray Experiments
A Graphical Investigation of Some Microarray Experiments. Brian S. Yandell Statistics , Horticulture, Biometry, University of Wisconsin-Madison www.stat.wisc.edu/~yandell/statgen. Key Questions. Why design microarray experiments? (Kerr Churchill) chips and samples are expensive


A Graphical Investigation of Some Microarray Experiments
E N D
Presentation Transcript
A Graphical Investigationof Some Microarray Experiments Brian S. Yandell Statistics , Horticulture, Biometry, University of Wisconsin-Madison www.stat.wisc.edu/~yandell/statgen Experimental Biology 2002
Key Questions • Why design microarray experiments? (Kerr Churchill) • chips and samples are expensive • design experiment for one or a few genes (want true replication) • Are typical statistical assumptions warranted? • how to transform to symmetry (near normal)? • how does the variance change? by gene? with abundance? • How do we combine data analysis across multiple genes? • differential expression pattern changes with abundance • how to keep potentially important low abundance genes? • noise pattern changes with abundance • How can we map gene expression? • use pattern of expression as one or more quantitative traits • Illustrate ideas with experiments from Attie Lab Experimental Biology 2002
But what about MY technology? • talk focuses on Affymetrix mouse chips • 13,000+ mRNA fragments (11,000+ genes) • = mean(PM) - mean(MM) adjusted expression levels • adaptable to other molecular data types • genome, proteome, metabolome, megagenome, virome • adaptable to emerging “micro-array” technologies • spotted arrays (Brown Botstein 1999) • micro-beads (www.lynxgen.com) • surface plasmon resonance (Nelson et al. Corn 2001) • maskless array synthesizer (www.nimblegen.com) Experimental Biology 2002
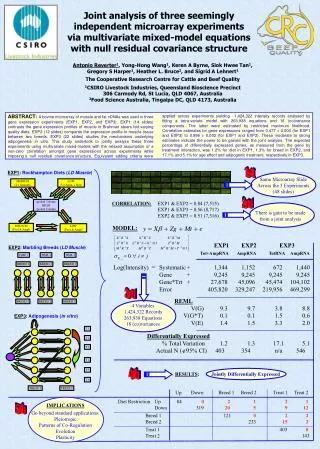
Design: learning by experience • fat and obesity • lean vs. obese • 3 “strains” • no replicates: 4 mice per chip • SCD knockout mouse • 5 replicates: 1 mouse per chip • knockout vs. wild type • 8 error degrees of freedom • fat, liver, muscle, islet tissues • 2 strains, 4 tissues • 2 replicates: 2 mice per chip • 8 error degrees of freedom Experimental Biology 2002
How are obesity & diabetes related? • focus on adipose (fat) tissue • whole-body fuel partitioning • Nadler et al. (2000) PNAS • 6 conditions in 2x3 factorial • lean vs. obese • strains B6, BTBR, F1 cross • pseudo-replication = subsampling • only 1 chip per condition • 4 mice pooled per chip • increase precision per chip • but reduce power to detect change • combine data across genes • no way to infer differences otherwise • noise decreases with average intensity Experimental Biology 2002
SCD knockout experiment • single gene knockout • stearoyl-CoA desaturase-1 • experimental design • knockout vs. wild type mice • 5 mice per group, 1 chip per mouse • dChip recalc of = PM-MM • have gene-specific replication • estimate noise from replicates within groups • compare genes in functional groups • up or down regulation? Experimental Biology 2002
Diabetes action in whole body • tissues important for diabetes • fat, muscle, liver, islets • focus on fat & liver here • two obese strains • BTBR diabetic • B6 non-diabetic • experimental design • only 16 Affymetrix chips • 2 replicates each tissue*genotype condition • 4 mice per condition in pools of 2 per chip • some benefits of pooling & independent replication Experimental Biology 2002
How do we infer strain differences? strain differences? same mean flat line noise negligible? high noise signal unreliable test inconclusive Experimental Biology 2002
Why is noise so important? • is differential expression “signal”large relative to “noise”? • signal is difference across conditions of interest • lean vs. obese, knockout vs. wild, B6 vs. BTBR • noise assessed by “true” replicates, not pseudo-replicates • sources of noise • conditions: mouse, strain, tissue • can vary with mRNA abundance, gene-specific features • materials: chip, mRNA sample preparation • hybridization and reading mechanics • watch out for pseudo-replication • pooled mRNA from multiple mice on one chip • multiple chips from same mRNA source • experimental unit is tissue from mouse (or set of pooled mice) • increase power with more mice on distinct chips • think of experiment for a single mRNA at a time Experimental Biology 2002
Are typical statistical assumptions warranted for microarrays? • independence: address at design phase • want chips independent, but gene spots on chip? • often expect genes to correlate--coordinated expression • equal variance • log (almost) takes care of this--or does it? • what affects variance? abundance? gene function? • normality (symmetry, bell-shaped histogram) • log (almost) transforms to symmetry? Experimental Biology 2002
To log or not to log? • log is natural choice • tremendous dynamic range (100-1000 fold common) • intuitive appeal, e.g. concentrations of chemicals (pH) • fold changes becomes additive • nice statistical properties ideally • noise variance roughly constant(?) • histogram roughly symmetric/normal • but adjusted values = PM – MM may be negative • approximate log transform: normal scores • there is an exact transform to normality • close to log() but exact form unknown: -1(F()) • handles negative background-adjusted values • close approximation easy to compute: X = -1(Fn()) • plot using anti-log to approximate fold changes Experimental Biology 2002
Approximate log transform: normal scores whole chip • = PM – MM • log10() note dropped data sample of 30 • rank() • X =-1(Fn()) squish blocks into bell shaped curve Experimental Biology 2002
How do we analyze multiple genes? • assume transformed expression is roughly normal • at least roughly symmetric • or use methods that account for data shape • find common patterns of differential expression • compare genes across conditions • how can we combine gene patterns? • use common patterns in noise • is variation in noise constant? probably not • mRNA abundance, gene function, gene-to-gene variability • how to model changing variation easily? • let design drive analysis • linear model based on experimental design • incorporate sources of variation Experimental Biology 2002
Gene-specific model for data analysis • fit linear model with conditions, genes, replicates • Xcgr = + Cc + Gg + Dcg + Ncgr • c = condition; g = gene; r = replicate • Cc = 0 if arrays normalized separately • Dcg = differential expression for condition c, gene g • Kerr Churchill (2001) • mean abundance of gene g: Ag = X•g• • differential expression: Dg = D1g– D2g • contrast among conditions = “signal” • lean vs. obese, B6 vs. BTBR, … Experimental Biology 2002
How to assess differential expression? • differential expression: Dg =cwc Xcg• • Dg = wc Dcg + wc Ncg• • Var(Dg) = g2+ g2/R = signal + noise • standardized contrasts: wc = 0, wc2= 1 • gene-specific variance of difference • Var(Dg) = g2/Rno differential expression • Var(Dg) = g2+ g2/Rdifferential expression • infer gene-specific differential expression • is signal g “large” relative to noise g ? • how to estimate SDg = g? Experimental Biology 2002
Two ways to measure noise SD • SDdecreases with abundance • mechanics of hybridization, reading • SDg2=(Ag)2 • can estimate without replication • combine information across genes • Newton et al. (2001), Roberts et al. (2000), Lin et al. (2001) • SD varies from gene to gene • biochemistry of specific mRNA • SDg2 = gene-specific g2 • need “substantial” replication (say 5?) • analyze genes separately • Efron et al. (2002), Lönnstedt Speed (2001) Experimental Biology 2002
Are SDs constant across genes? gene-specific SD using replicates abundance-based SD using mean contrasts 95% 82limits Experimental Biology 2002
How to Estimate Spread of Noise? • focus on genes with no differential expression • assume SD changes with abundance Ag • use robust estimate SDg = (Ag) across genes • screens out changing genes as “outliers” • focus on replication • measure expression noise by deviations from mean • SDg2 = cr(Xcgr –Xcg•)2 / 1 • Combine ideas into gene-specific hybrid • Gene-specific SDs vary around (Ag) • “prior” g2 ~ inv-2(0, (Ag)2) • combines two “statistically independent” estimates Experimental Biology 2002
Adipose: no replication low abundance (some < 0) Clustering (Nadler et al. 2000) significant change Experimental Biology 2002
Why Worry about Low Abundance Genes? • expression may be at or below background level • background adjustment: = PM – MM • removes local “geography” • allows comparison within and between chips • can be negative--problem with log transform • large measurement variability • early technology (bleeding edge) • do next generation chips really fix this? • low abundance genes • mRNA virtually absent in one condition • could be important: transcription factors, receptors, regulators • high prevalence across genes on a chip • up to 25% per early Affy chips (reduced to 3-5% with www.dChip.org) • 10-50% across multiple conditions • low abundance signal may be very noisy • 50% false positive rate even after adjusting for variance • may still be worth pursuing: high risk, high research return Experimental Biology 2002
Adipose: What was Found? • transcription factors • I-kB modulates transcription - inflammatory processes • RXR nuclear hormone receptor - forms heterodimers with several nuclear hormone receptors • regulatory proteins • protein kinase A • glycogen synthase kinase-3 • roughly 100 genes • 90 new since Nadler (2000) PNAS • but 50% false positives! Experimental Biology 2002
Robust SD varying with abundance • median & median absolute deviation (MAD) • robust to outliers (e.g. changing genes) • easy to compute • adapt to patterns in data rather than idealized model • partition genes into slices based on abundance Ag • use many slices to assess how SD varies • ~30 genes per slice for Affy mouse chips (400 slices) • smooth median & MAD over slices • automated smoothing splines (Wahba 1990) • smoothes out slice-to-slice chatter Experimental Biology 2002
Median & MAD by abundance slices(1% sample) Experimental Biology 2002
Adipose: center and spread low abundance (some < 0) Clustering (Nadler et al. 2000) significant change (Bonferroni limits) Experimental Biology 2002
Standardized Genotype Effects standardized effects Dg / (Ag) add = BTBR - B6 dom = F1-(BTBR+B6)/2 significant change Bonferroni lines Experimental Biology 2002
Are strain differences real? strain differences? similar pattern parallel lines no interaction noise negligible? few d.f. per gene Can we trust SDg? Experimental Biology 2002
Improving on gene-specific SD • gene-specific SD from replication • SDg2 = cr(Xcgr –Xcg•)2 / 1 • robust abundanced-based estimate • (Ag) = smoothed MAD • Combine ideas into gene-specific hybrid • “prior” g2 ~ inv-2(0, (Ag)2) • “posterior” shrinkage estimate 1SDg2 + 0(Ag)2 1 + 0 • combines two “statistically independent” estimates Experimental Biology 2002
SD for strain differences gene-specific g smooth of g main effects fat (Ag) liver (Ag) interaction fat-liver (Ag) Experimental Biology 2002
Shrinkage Estimates of SD gene-specific g abundance (Ag) 95% 82limits new (shrunk) g size of shrinkage 1g2 + 0(Ag)2 1 + 0 Experimental Biology 2002
How good is shrinkage model? prior for gene-specific g2 ~ inv-2(0, (Ag)2) fudge to adjust mean 1g2 + 0(Ag)2 1 + 0 histogram of ratio g2/ (Ag)2 empirical Bayes estimates 2approximation 0 = 5.45, = 1 2 approximation with 0 = 3.56, = .809 used 0 = 8, = 1 in figures Experimental Biology 2002
Effect of SD Shrinkage on Detection fat-liver interaction shrinkage-based abundance-based 9 genes identified Experimental Biology 2002
Liver vs. Fat effects significant change 9 genes identified Bonferroni lines Experimental Biology 2002
How to detect patterns of expression? • differential expression--or not? • Dg / (Ag) ~ Normal(0,1) ? • no differential expression (most genes) • differential expression more dispersed than N(0,1) • evaluation of differential expression • formal test of outliers: multiple comparisons • posterior probability in differential group • want to control false positives & false negatives • general pattern recognition • in which group does gene belong? • clustering, discrimination & other multivariate approaches • linear discriminants are natural extension of ideas here • are these groups different? • comparison of functional groups Experimental Biology 2002
Multiple Comparisons: a concern? • many tests performed at once • goal: detect genes with “large” differential expression • formality: is Dg/ (Ag) ~ Normal(0,1) ? • practice: use multiple comparisons as guideline • simple multiple comparisons approach • Zidak/Bonferroni corrected p-values: p = p1/n • 13,000 genes with an overall level p = 0.05 • each gene should be tested at level p1 = 1.95*10-6 • differential expression if Dg/ (Ag) > 4.62 • is this too conservative? (Dudoit et al. 2000) • re-envigorated multiple comparisons “industry” Experimental Biology 2002
all multiple comparisons similar uniform g/(1+n) p-value nominal .05 Holms Sidak Bonferroni Experimental Biology 2002
pattern of standardized differences standardized differences Dg/ (Ag) standard normal differential expression Bonferroni cutoff after Efron et al. (2001) Experimental Biology 2002
Comparing gene function groups 9 functional groups 115 significant genes 5-20 genes/group dropped unknowns up or down regulation? relative to gene-to-gene variation Experimental Biology 2002
Related Literature • comparing two conditions • log normal: var=c(mean)2 • ratio-based (Chen et al. 1997) • error model (Roberts et al. 2000; Hughes et al. 2000) • empirical Bayes (Efron et al. 2002; Lönnstedt Speed 2001) • gene-specific Dg ~ , var(Dg) ~-1, Zg ~ Bin(p) • gamma • Bayes (Newton et al. 2001, Tsodikov et al. 2000) • gene-specific Xg ~, Zg ~ Bin(p) • anova (Kerr et al. 2000, Dudoit et al. 2000) • log normal: var=c(mean)2 • handles multiple conditions in anova model • SAS implementation (Wolfinger et al. 2001) • See www.stat.wisc.edu/~yandell/statgen References Experimental Biology 2002
R Software Implementation • quality of scientific collaboration • hands on experience to researcher • focus on graphical information content • needs of implementation • quick and visual • easy to use (GUI=Graphical User Interface) • defensible to other scientists • open source in public domain? • www.r-project.org • www.bioconductor.org Experimental Biology 2002
library(pickgene) ### R library library(pickgene) ### create differential expression plot(s) result <- pickgene( data, geneID = probes, renorm = sqrt(2), rankbased = T ) ### print results for significant genes print( result$pick[[1]] ) ### density plot of standardized differences pickedhist( result, p1 = .05, bw = NULL ) Experimental Biology 2002
Mapping Gene Expressionas a Quantitative Trait? • gene expression in segregating population • assume one gene locus (QTL) influences expression • create backcross (BC) or intercross (F2) • map QTL using expression as quantitative trait • scan entire genome for possible QTL • MapMaker, QTL Cart or other package • gene expression may be controlled by other QTL • multiple genes influenced by same QTL? • is QTL at a regulatory gene? • multiple QTL affecting some regulatory gene? Experimental Biology 2002
From genes to regulatory genes • X = expression data from chips for F2 population • too many gene expressions to map separately • reduce dimension using multivariate approach • principle components (singular value decomposition) • X = UDVT • V has eigen-genes as rows, individuals as columns • V = combined expression of coordinated genes • map first few important rows of V as quantitative traits • suppose coordination due to gene regulation • elicit biochemical pathways (Henderson et al. Hoeschele 2001) • increase power to detect expression-modifying QTL Experimental Biology 2002
Alter et al. (2000 PNAS) yeast cell cycle X = UDVT Experimental Biology 2002
Idea of test for QTL at one locus (using graphs from West et al. 2000) colored correlation matrix t-tests at QTL locus regulators X = gene signal genes V = regulator signal Experimental Biology 2002
Multiple QTLs • mapping principle component as quantitative trait • Liu et al. (1996); Zeng et al. (2000) • multiple interval mapping with interactions • research groups working on expression QTLs • Doerge et al. (Purdue) • Jansen et al. (Waginingen) • multiple QTL literature • multiple interval mapping • Zeng, Kao, et al. (1999, 2000) • Bayesian interval mapping • Satagopan et al. (1996); Satagopan, Yandell (1996); Stevens, Fisch (1998); Silanpää, Arjas (1998, 1999) Experimental Biology 2002
Summary • Why design microarray experiments? (Kerr Churchill) • chips and samples are expensive: use resources well • design experiment for one gene with true replication • Are typical statistical assumptions warranted? • not automatically--plot your data! • find transform to symmetry (near normal) • examine how SD changes with abundance • How do we combine data analysis across multiple genes? • keep low abundance data & allow model noise with abundance • use formal tests as guide to false positive rate • How can we map gene expression? • use multivariate summaries to capture functional patterns • expression may be controlled by other (regulatory) gene • Ongoing collaboration requires continual dialog Experimental Biology 2002
Alan D. Attie3 Hong Lan3 Samuel T. Nadler3 3UW-Madison Biochemistry Yi Lin1 Yang Song1 Fei Zou5 Christina Kendziorski4 1UW-Madison Statistics 4UW-Madison Biostatistics 5UNC Biostatistics Collaboratorswww.stat.wisc.edu/~yandell/statgen Experimental Biology 2002