
Uploaded by
doli
0 SLIDES
154 VUES
0LIKES
Selecting the Right Graph for Student Enrollment Data at Texas Christian University
DESCRIPTION
In this 8th Grade Science Bell Ringer, students engage with the process skills surrounding data representation. The scenario presented involves the Enrollment Department at Texas Christian University, which aims to display the percentage distribution of students across different academic years: freshman, sophomore, junior, and senior. Students will analyze the best type of graph to effectively convey this information, encouraging critical thinking about data visualization methods.
Download

1 / 0
Télécharger la présentation 
Selecting the Right Graph for Student Enrollment Data at Texas Christian University
An Image/Link below is provided (as is) to download presentation
Download Policy: Content on the Website is provided to you AS IS for your information and personal use and may not be sold / licensed / shared on other websites without getting consent from its author.
Content is provided to you AS IS for your information and personal use only.
Download presentation by click this link.
While downloading, if for some reason you are not able to download a presentation, the publisher may have deleted the file from their server.
During download, if you can't get a presentation, the file might be deleted by the publisher.
E N D
Presentation Transcript
- 8th Grade Science Bell Ringers Author: LaSina M. Jackson
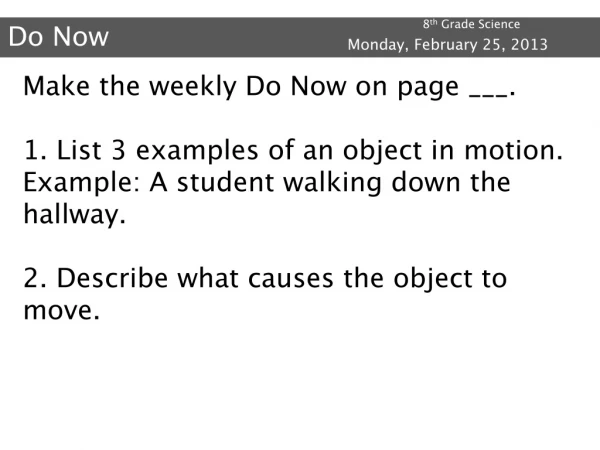
- Process SkillsGraphs For All The enrollment department at Texas Christian University wishes to show what percentage of students are freshman, sophomores, juniors, and seniors. What type of graph should they use? A student wants to compare her GPA for each semester she was enrolled as an art major at Dallas Baptist University. What type of graph should she use? A basketball player from the University of Texas at Arlington’s basketball team wants to see his trend of 3-point shots made over the last five games. What type of graph should he use? Author: LaSina M. Jackson
- Matter and EnergyName That Element The science lab at Southern Methodist University needs help identifying atoms. Use a periodic table to decide which elements are pictured below. 1. 2. 3. 4. Now place the previous elements in order by increasing reactivity. P = 4 N = 5 P = 10 N = 10 P = 1 N = 0 Author: LaSina M. Jackson
- Earth and SpaceAnd Then What… Students from astronomy classes from Mountain View College are trying to predict the moon phases that will occur. Help them by naming the moon phase that would occur after the following. 1. 2. 3. Author: LaSina M. Jackson
- Force, Motion, and EnergyNewton’s Laws Are Everywhere A professor at Brookhaven College took physics students to an amusement park to demonstrate some science concepts. They were able to find examples of all 3 of Newton’s Laws of Motion while riding a roller coaster. Fill in the picture below with the law that explains that part of the ride. 1. When the car goes down the hill, gravity causes it to go faster. 2. Safety harnesses are used to keep people in the car. 3. The ramp has lots of support beams which can hold the weight of the car on the track. Author: LaSina M. Jackson
- Organisms and EnvironmentThe Food Chain Gang The ecology students at the University of North Texas went to observe organisms in their natural habitat. They observed the relationship shown below. Which statement is most likely true about the relationship shown? If the frog population increases, the hawk population will decrease. If the snake population decreases, the frog population will increase. If the frog population decreases, the snake population will increase. If the hawk population decreases, the snake population will decrease. Frog Snake Hawk Author: LaSina M. Jackson


More Related