Download
1 / 20
210 likes | 488 Vues
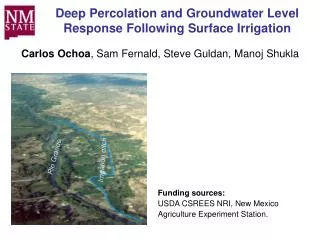
Deep Percolation and Groundwater Level Response Following Surface Irrigation. Rio Grande. Irrigation ditch. Carlos Ochoa , Sam Fernald, Steve Guldan, Manoj Shukla. Funding sources: USDA CSREES NRI, New Mexico Agriculture Experiment Station.

E N D
Deep Percolation and Groundwater Level Response Following Surface Irrigation Rio Grande Irrigation ditch Carlos Ochoa, Sam Fernald, Steve Guldan, Manoj Shukla Funding sources: USDA CSREES NRI, New Mexico Agriculture Experiment Station.
Deep percolation from irrigation can provide a fair amount of water recharge to shallow aquifers. Valley scale Basin scale • USDA CSREES-funded study to determine seepage effects on Rio Grande flow in an irrigated valley in northern New Mexico (2004-2009). Farm scale NMSU-Sustainable Agriculture Science Center
Previous study findings (2004-2007) – Deep percolation: • A 15-62%Dp in an alfalfa field with sandy-loam soil • A 14-42%Dp in an apple orchard with sandy-clay and clay soil • Rapid water level response and water level rise up to 35 cm Water level (m ASL) Soil moisture sensors Alfalfa field
Study objectives: • Determine deep percolation following flood irrigation in two crop fields with different soil type. • Assess the performance of the Root Zone Water Quality Model in simulating deep percolation. 1 m Deep percolation • Characterize groundwater level fluctuations in response to deep percolation inputs. Shallow Aquifer
Experimental design: • Two 100 m by 100 m fields • Two soils: Fruitland sandy-loam and Werlog clay-loam • Shallow water table (sandy-loam = 4 m and clay-loam = 2.8 m) • Surface (flood) irrigation • Cover crop (oats/grass mix) • Parameters: • Irrigation depth • Soil water content • Field runoff • Water level Sandy-loam Clay-loam NMSU-Sustainable Agriculture Science Center
Measured and simulated deep percolation • A daily water balance method based on field measurements DP = SWCi + IRR + P - SWCfc – RO – ET • The Root Zone Water Quality Model – Hydrology component Input Output • Crop type • Rainfall data • Meteorological data • Soil horizons and properties • Water applied • Deep percolation
Field data collection – Schematic of instrumentation N Propeller flow meter Water source Soil moisture station Flow 100 m Field runoff Driven point well 1m 100 m Slope Open channel-flow meter 100 m
soil moisture station/well Outer well N
Irrigation applied and field runoff • Irrigation applied • 12 irrigation events in each field (2008-2009) • Variable irrigation depth (4 to 22 cm) Propeller flow meter • Field runoff • Open channel S-M flume with pressure transducer S-M flow meter
Soil water content and groundwater monitoring Soil moisture sensors 50 cm • Vertical nests of soil moisture sensors • Driven point wells equipped with water level loggers • Instrumentation installed and soil repacked 15 months prior to this experiment Well Sandy loam Clay loam
Fruitland sandy loam soil: • Deep percolation (DP) observed in 4 out of 12 irrigation events • DP ranged from 9 to 27 %
Werlog clay loam soil: • When DP present, high antecedent soil moisture observed • DP ranged from 58 to 74 %
Field-measured (DWBM) versus simulated (RZWQM) DP: • Regardless of soil type, preliminary simulated results with minimum input data show a fair agreement with field-measured based deep percolation.
Water level response: Werlog clay-loam field • Water level rise of up to 16 cm observed following highest IRR. IRR = 23 cm
Water level response: Fruitland sandy-loam field • Water level rise of up to 2 cm in the midfield well following highest IRR. IRR = 26.7 cm
Water level response: Fruitland sandy-loam field • In general, muted water level response (0 to 2 cm) observed following IRR.
Conclusions • Regardless of soil type, deep percolation was only observed during few irrigation events. • Higher antecedent soil moisture and shallower water table contributed to greater deep percolation and higher water table rise in the clay loam soil. • Fair agreement between simulated (RZWQM) and field-measurement (DWBM) DP. • In general, lower water level rise and longer time of response when compared to previous study results (Alfalfa and Apple fields).
Water level response: Werlog clay-loam field • Water level rise of up to 8 cm in the midfield well following IRR = 23 cm.