Download
1 / 17
170 likes | 196 Vues
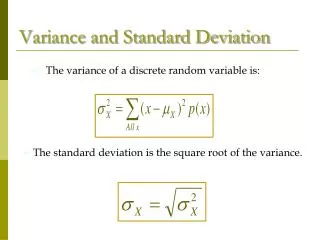
Learn about the difference between SS, SS, σ^2, and s^2, as well as the importance of variance estimates and standard deviation in data analysis.

E N D
Wednesday October 7 Deeper Understanding of Variance and Standard Deviation Data Transformation
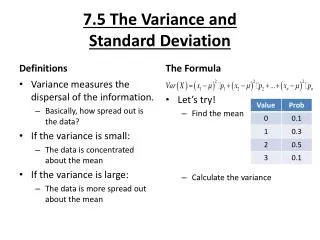
SS SS 2 s2 = = N (N - 1) What’s the difference?
SS SS 2 s2 = = N (N - 1) What’s the difference? (occasionally you will see this little “hat” on the symbol to clearly indicate that this is a variance estimate) – I like this because it is a reminder that we are usually just making estimates, and estimates are always accompanied by error and bias, and that’s one of the enduring lessons of statistics) ^
SS s = (N - 1) Standard deviation.
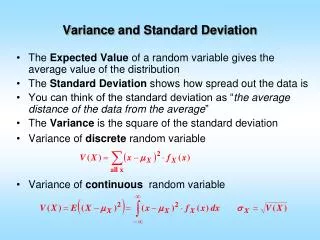
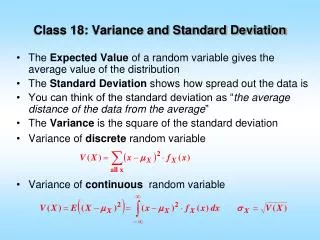
Standard Deviation in Words • The standard deviation is an expression (and usually an estimate) of the average deviation of all the data points from the mean of the data pool of interest (expressed in the same unit of measurement as that for the mean).
Standard Deviation in Words • The standard deviation is an expression (and usually an estimate) of the average deviation of all the data points from the mean of the data pool of interest (expressed in the same unit of measurement as that for the mean). • What’s that good for?
Life Expectancy • If you are male, your mean life expectancy at this time is 76. • If you are female, your mean life expectancy is 82.
Life Expectancy • If you are male, your mean life expectancy at this time is 76. • If you are female, your mean life expectancy is 82. • Is this a small, medium, or big difference?
Life Expectancy • If you are male, your mean life expectancy at this time is 76. • If you are female, your mean life expectancy is 82. • Is this a small, medium, or big difference? • What if s=6? s=12? s=18?
Data Transformation Last week, we already saw one kind of data transformation: Percentile Rank Converting scores to percentile ranks allows comparison across measures with different metrics. For example, you can ask if your percentile rank in height (inches) predicts your percentile rank in weight (pounds).
Data Transformation Last week, we already saw one kind of data transformation: Percentile Rank Converting scores to percentile ranks allows comparison across measures with different metrics. For example, you can ask if your percentile rank in height (inches) predicts your percentile rank in weight (pounds). Transforming interval scores to ordinal (percentile rank) scores lost information about the shape of the distribution.
Data Transformation Last week, we already saw one kind of data transformation: Percentile Rank Converting scores to percentile ranks allows comparison across measures with different metrics. For example, you can ask if your percentile rank in height (inches) predicts your percentile rank in weight (pounds). Transforming interval scores to ordinal (percentile rank) scores lost information about the shape of the distribution. The Z-score transformation converts scores to a standard format, with a mean of 0 and a standard deviation of 1, while preserving the shape of the distribution.
Z-score transformation _ Xi - X Zi = Converts scores into the distance in standard deviation units from the mean, with negative values being below the mean and positive values being above the mean. _ Z = 0, z=1
Because z-scores are in standard units: • you can compare positions across different variables that use different units of measurement (you can compare apples with oranges!) • you can quickly see if the position of an individual relative to the distribution is similar or different.
T-Score converts Z by multiplying by 10 and adding 50 T = 10Z + 50 This distribution has a mean of 50 and a standard deviation of 10. This conversion helps those who are frightened by negative numbers and decimal points.
SATs and GREs are transformed to have a mean of 500 and a standard deviation of 100. SAT = 100Z + 500