Walking Data Analysis
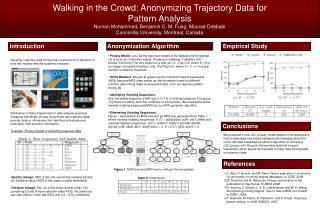
This research delves into pedestrian navigation and collision dynamics, analyzing how individuals fixate on pedestrians while walking. Experiments conducted reveal that pedestrians spend approximately 30% of their fixation on potential colliders, even though collision detection rates are only about 60%. Through varied trial types, including leader and no-leader conditions, findings indicate that while fixation patterns can adapt to collision probabilities, other factors such as stimulus properties play a limited role. This study opens the door to questions about how pedestrians learn about collision probabilities and adjust their fixation rates accordingly.

Walking Data Analysis
E N D
Presentation Transcript
Background • Jovancevic et al 2006 • Where do you look while navigating? • Same experimental environment you used. • But… • Any pedestrian could collide at 10% probability • Leader & No-Leader trial types • 18 laps of experience per trial type • Another condition where colliders sped up
Results • Looks at pedestrians are about ~30% of fixations • Fixation patterns are sensitive to low probability events • But collisions aren’t always detected (~60%) • Bottom up capture is weak • Top down scheduling seems more plausible • Open Question (addressed by your lab): • How do people learn about the probabilities? • Probability matching? • At what rate?
Other results • Speeding up had little effect • Stimulus properties don’t correlate well with fixations (eg. color, angle of rotation, distance away). • Fixating a collider makes the subject slow down
Experimental Manipulation • Two trial types • Controls: No collisions (baseline rate of fixation) • Experimental (with collisions) • Probabilities of collision: • 3 pedestrians: • Walking in subjects direction • 80%, 50%, and 20% collision rate • 2 pedestrians: • Walking in subjects direction • No (intentional) collisions
Results: Qualitative • What were the goals? • Stay on the sidewalk (near middle) • Avoid Pedestrians • Where do the eyes generally go? • Sidewalk • Pedestrians • Surroundings • Wall
Quantitative • Do the rates of fixation match the rates of collision? • 1) Determine how many times each pedestrian appeared & collided • Calculate the pedestrian collision rate per subject • 2) For each appearance determine if the pedestrian was fixated.
Quantitative cont. • 3) Calculate overall fixation probability (all ~12 laps) per pedestrian • 4) Calculate fixation probability per pedestrian for early, middle, and late trials • Calculate per subject and do means across (if you have enough data) • Compare control vs. experimental trials • Do subjects fixate peds more frequently in the exp. Condition? • Is the learning rate (early, middle, late) flat for control trials? • Experimental • What is the overall rate of fixation probability • What is the rate of fixation for early, middle, late trials
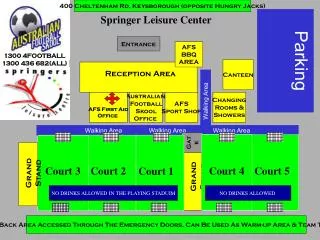
Movie & Excel Example • Start : 00:25 • Collision 0:30, 45
Discussion • Do subjects fixate colliders more often? (compare experimental vs. control) • Do your results show that subjects adjust fixation rates to the rates of collision? • If so how quickly? • If not what happened instead? • How does this fit with the Jovancevic paper? • If you want to analyze more… • Fixation Latencies, Duration distributions (like Figure 6)