Download
1 / 1
10 likes | 111 Vues
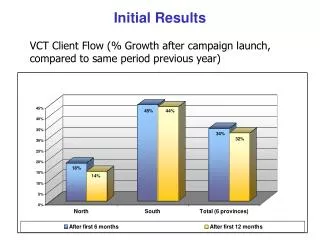
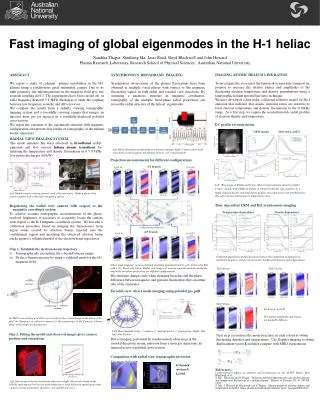
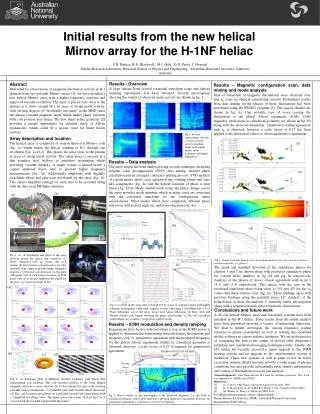
Preliminary results and data analysis from the new helical Mirnov array for the H-1NF heliac, detecting magnetic fluctuations and Alfvén eigenmodes. Mode analysis, spectrograms, and cluster phases are discussed.

E N D
Antenna currents(red and black) Density (blue) Initial results from the new helical Mirnov array for the H-1NF heliac Array S.R. Haskey, B.D. Blackwell, M.J. Hole, D.G. Pretty, J. HowardPlasma Research Laboratory, Research School of Physics and Engineering, Australian National University, Canberra, Australia Array Results - Overview A large dataset from several rotational transform scans and density ramping experiments has been obtained. Several spectrograms showing the variety of observed mode activity are shown in fig. 3. Results – Magnetic configuration scan, data mining and mode analysis Tens of thousands of magnetic fluctuations were observed over four κh scans (κh =helical current/ring current). Preliminary results from data mining on the phases of these fluctuations has been performed using the SWM11 program [3]. The largest clusters are shown in fig. 6a. One possible type of wave causing the fluctuations is the global Alfvéneigenmode (GAE). GAE frequency predictions in cylindrical geometry are shown in fig. 6b along with the observed datapoints. Qualitative scaling agreement with κhis observed; however a scale factor of 0.27 has been applied to the theoretical values to obtain quantitative agreement. Abstract Motivated by observations of magnetic fluctuation activity in H-1 plasmas from two poloidal Mirnov arrays [1], we have installed a new helical Mirnov array with a higher frequency response and improved toroidal resolution. The array is placed very close to the plasma as it twists around H-1, in areas of strong mode activity, with varying degrees of “favourable curvature” in the MHD sense but almost constant magnetic angle which makes phase variation with coil position near linear. The low shear heliac geometry [2] provides a unique opportunity for detailed study of Alfvén eigenmodes, which could be a serious issue for future fusion reactors. Fig 3. Several spectrograms showing a variety of mode activity including single and multiple modes, mode transitions and higher frequencies. Array description and location The helical array is composed of sixteen three-axis Mirnov coils (fig. 1c) which follow the helical winding of H-1 through one revolution (fig. 1a,1b,2). This places the array close to the plasma in areas of strong mode activity. The entire array is encased in a thin stainless steel bellows to minimise attenuation whilst providing vacuum integrity. A single former is placed inside a copper sputtered Pyrex tube to provide higher frequency measurements (fig. 1d). Additionally amplifiers with digitally switchable filters and gain were developed for the array (fig. 1f). This allows amplifier settings for each shot to be recorded along with the data in an MDSplus database. (a) Results – Data analysis The array output has been analysed using several techniques including singular value decomposition (SVD), data mining, analytic phase calculation and an averaged coherence picking process. SVD analysis of certain modes shows clear separation into rotating cosine and sine-like components (fig. 4a) and the helical variation of phase is near linear (fig. 4b,d). Mode identification using the phase change across the array provides mode numbers which in many cases are consistent with the rotational transform for the configuration under consideration. Other modes which have completely different phase behaviour with helical angle are under investigation (fig. 4e). (b) (b) (a) (c) (c) (a) Chronos Singular Values (b) (d) (e) (d) (e) Time (ms) (f) PSD of chronos Topos (g) Fig 1. (a), (b) Rendering and photo of the array twisting around the central ring conductor. (c) Three orthogonal coils are wound onto each former. (d) One former is placed inside a test tube sputtered with copper to provide higher frequency response. (e) Positive coil directions for the three orthogonal coils at each former location. (f) PCB panel with six of the pre-amplifiers developed for the array. (g) Argon discharge in H-1. (d) Fig 6. Results from data mining (a,b), cluster phase analysis (d,e) and a plot of rotational transform in radius v kh space (c) (e) (c) The mean and standard deviation of the cumulative phases for clusters 3 and 7 are shown along with predicted cumulative phase for various mode numbers in fig. 6d and fig. 6e respectively. Analysis of the phases of shows closest agreement with (n,m) = (4,3) and (5,4) respectively. This agrees with the zero in the rotational transform shear being close to 5/4 and 4/3 for the κh values that these clusters exist (fig. 6c). These findings agree with previous findings using the poloidal arrays [1]. Analysis of the polarization of these fluctuations is currently under investigation along with a comparison with optical emission observations. (a) Fig 4. (a) SVD of the array data is dominated by a pair of singular values with highly coherent (orthogonal) sinusoidal singular vectors indicating a travelling wave. (b,c) Phase difference across the array shows near linear behaviour. (d) Raw (red) and filtered (black) coil signals showing the phase relationship. (e) Not all coil-phase relationships are as linear – suspected coupled modes. Conclusions and future work A 48 coil helical Mirnov array and associated systems have been installed in the H-1 heliac. Some results from the initial analysis have been presented showing a variety of interesting behaviour. We plan to further investigate the various frequency scaling relations to plasma parameters as well asrelating the identified modes to theory in a more realistic geometry. We are in the process of comparing the data to the output of several other diagnostics including new synchronous imaging technique results. Finally, the H-1 heliachas recently received a major upgrade to the ICRH heating system and an upgrade to the interferometer system is underway. These new systems as well as plans to use an active excitation antenna should not only provide a wider range of plasma conditions but also provide substantially more density information and variety of fluctuations to use in our analysis. Results – ICRH modulation and density ramping Experiments have been conducted where a step in the ICRH power is applied to determine the relationship between density fluctuations and frequency (fig. 5). Qualitative agreement with the predicted frequency for the global Alfvén eigenmode (GAE) in cylindrical geometry is obtained; however, a scale factor of 0.27 is required for quantitative agreement. rational surfaces zero shear (b) (c) (d) Helical Poloidal Acknowledgements: John Wach and the H-1 team for machine operations. This work was supported by AINSE and ANSTO. References: [1] D. G. Pretty, PhD Thesis, Australian National University, 2007. [2] B. D. Blackwell et al., 21st IAEA Fus. Energy Conf., Chengdu, China (2006). [3]M. Shinder, A. Wong, A. Meyerson, NIPS 2011. Fig 2. (a) Poincaré plots at different toroidal locations with black dots representing coil location. The coil location relative to the bean shaped magnetic surfaces is near constant. (b) Coil locations for one of the existing poloidal arrays (numbered). (c) Poloidal (red) and toroidal (blue) directions (d) The coil locations are plotted on a poloidal-toroidal lab frame plane with a simplified travelling wave. The array traces out a near “helical line” as it crosses both the toroidal and poloidal directions. For additional information contact:Shaun Haskey Plasma Research Laboratory, RSPE, Australian National University shaun.haskey@anu.edu.au Fig 5. Black overlay in the spectrogram is the predicted frequency for the GAE in cylindrical geometry with a short time delay showing qualitative agreement; however, for quantitative agreement a scale factor of λ=0.27 is required