Atmospheric Sounding Visualization
Atmospheric Sounding Visualization. Sancho McCann. Outline. Domain description Current presentation formats Proposed Solution Progress. Pressure. Altitude. Temperature. Dewpoint. Soundings. Soundings. 72694 SLE Salem Observations at 12Z 08 Oct 2006

Atmospheric Sounding Visualization
E N D
Presentation Transcript
Atmospheric Sounding Visualization Sancho McCann
Outline • Domain description • Current presentation formats • Proposed Solution • Progress
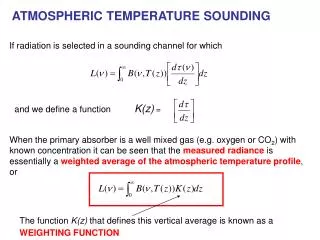
Pressure Altitude Temperature Dewpoint Soundings
Soundings 72694 SLE Salem Observations at 12Z 08 Oct 2006 ----------------------------------------------------------------------------- PRES HGHT TEMP DWPT RELH MIXR DRCT SKNT THTA THTE THTV hPa m C C % g/kg deg knot K K K ----------------------------------------------------------------------------- 1020.0 61 6.0 3.8 86 4.95 0 0 277.6 291.2 278.4 1000.0 224 10.0 6.9 81 6.28 15 4 283.1 300.7 284.2 997.0 249 10.2 7.1 81 6.38 17 5 283.6 301.5 284.7 990.3 305 10.0 6.8 80 6.30 20 6 284.0 301.6 285.0 954.6 610 9.0 5.2 77 5.83 25 9 286.0 302.6 287.0 925.0 871 8.2 3.8 74 5.46 5 12 287.7 303.4 288.6 920.2 914 8.1 4.0 75 5.56 5 12 288.0 304.0 289.0 909.0 1015 7.8 4.4 79 5.80 2 14 288.7 305.4 289.7 902.0 1079 8.8 -11.2 23 1.81 360 15 290.4 296.0 290.7
Current Presentation Methods Emagram
Current Presentation Methods Skew-T Log-P
Critique • Much training required • Difficult to compare quickly • Difficult to use for presentation to novice students • Easy to distribute • Complexity might aid understanding
Previous Work • Only modifications to Skew-T • Haeger: Vertical ocean profiles
S.D. Haeger. Vertical representation of ocean temperature profiles with a gradient feature model. In Proceedings of OCEANS '95. MTS/IEEE 'Challenges of Our Changing Global Environment'. San Diego, CA, 1995
Proposed Solution • Derive variables • Display on an annotated bar plot
Use • 14-17 year olds that have just completed an introduction to meteorology class
Implementation Details • Data source: http://weather.uwyo.edu/upperair/sounding.html • Java/swing in Eclipse
Outstanding Issues • Interaction with sounding plot • Small multiple layout for comparisons by location or time • How to force a visual link Slope of temperature Stability