Download
1 / 104
1.04k likes | 1.06k Vues
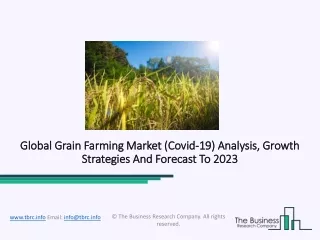
Explore the 2010 grain market forecast, economic indicators affecting prices, and in-depth analysis of the ACRE program for farmers' revenue support. Understand supply/demand dynamics, global production trends, and government payment strategies.

E N D
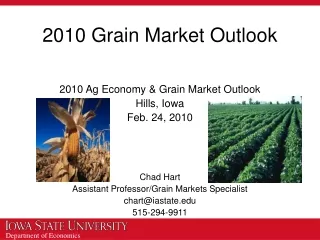
2010 Grain Market Outlook 2010 Ag Economy & Grain Market Outlook Hills, Iowa Feb. 24, 2010 Chad Hart Assistant Professor/Grain Markets Specialist chart@iastate.edu 515-294-9911
U.S. Corn Supply and Use Source: USDA
U.S. Corn Harvest Progress Source: USDA
U.S. Soybean Supply and Use Source: USDA
U.S. Soybean Harvest Progress Source: USDA
Storage Issues Source: Hurburgh and Elmore, ICM News, 10/15/09
World Corn Production Source: USDA
Corn – Argentina & Brazil Source: USDA
World Soybean Production Source: USDA
Soybeans – Argentina & Brazil Source: USDA
Hog Returns vs. Corn Prices Sources: ISU Extension, Farrow-to-Finish; USDA-NASS
Cattle Returns vs. Corn Prices Sources: ISU Extension, Yearling Steers; USDA-NASS
Hog Crush Margin The Crush Margin is the return after the pig, corn and soybean meal costs. Carcass weight: 200 pounds Pig price: 50%of 5 mth out lean hog futures Corn: 10 bushels per pig Soybean meal: 150 pounds per pig Source: Dr. John Lawrence, ISU Extension
Cattle Crush Margin The Crush Margin is the return after the feeder steer and corn costs. Live weight: 1250 pounds Feeder weight: 750 pounds Corn: 50 bushels per head Source: Dr. John Lawrence, ISU Extension
Exchange Rates (Jan. 2003 = 1) Source: USDA, ERS
Corn Export Sales Source: USDA, FAS
2009 U.S. Corn Exports Source: USDA, FAS
Soybean Export Sales Source: USDA, FAS
2009 U.S. Soybean Exports Source: USDA, FAS
Ethanol Margins Source: ISU, CARD
Crude Oil Prices Sources: EIA, NYMEX
Corn 1990 - 2006
Corn Futures Trade Source: CFTC
Soybean Futures Trade Source: CFTC
Corn Futures Source: CBOT, 2/23/10
Soybean Futures Source: CBOT, 2/23/10
Ratio: Nov. 2010 Soy/Dec. 2010 Corn Source: CBOT
Input Costs Source: USDA, Agricultural Prices, Jan. 29, 2010
Thoughts for 2009/10 and Beyond • General economic conditions • Projected economic recovery is a major key for crop prices • Weakness in the dollar helps exports, but dollar may fight back • Nearby crude oil prices floating in mid to upper $70’s • Supply/demand concerns • Livestock numbers continue to decline • South America: Record soybean crop and large corn crop • 2009/10: USDA: Corn $3.70, Soy $9.45 Futures: Corn $3.52, Soy $9.32 • 2010/11: USDA: Corn $3.60, Soy $8.80 Futures: Corn $3.87, Soy $8.94
Average Crop Revenue Election (ACRE) • ACRE is a revenue-based counter-cyclical payment program • Based on state and farm-level yields per planted acre and national prices • Producers choose between the current price-based counter-cyclical payment (CCP) program and ACRE • Program has state and farm trigger levels, both must be met before payments are made
ACRE Settings ACRE is based on planted acres Total acres eligible for ACRE payments limited to total number of base acres on the farm Farmers may choose which planted acres are enrolled in ACRE when total base area is exceeded
ACRE Payments • Payment rate = Min(ACRE revenue guarantee – ACRE actual revenue, 25% * ACRE revenue guarantee) • ACRE payment adjustment: Payment multiplied by ratio of Expected farm yield to Expected state yield • Payments made on 83.3% of planted acres in 2009-11, 85% in 2012 (up to total base acres)
ACRE Payment Timing Payments can begin as soon as practicable possible after the end of the marketing year So 2009 ACRE payments could start to be paid out in October 2010 There are no provisions for advance payments
ACRE Set-up for 2009 Iowa Corn So the expected state yield would be 171.0 bushels per acre and the ACRE price guarantee would be $4.13 per bushel.
Using Latest USDA Projections ACRE revenue guarantee = $635.61/acre 90% * $4.13/bu. * 171.0 bu./acre Proj. ACRE actual revenue = $673.40/acre $3.70/bu. * 182.0 bu./acre No payments under this scenario Would need yields to fall to 172 bu/acre or price to fall to $3.49 to trigger payments
ACRE Payment Rate Matrix ($/acre) Price Yield USDA
ACRE Set-up for 2010 Iowa Corn The 2009 yields and prices are USDA’s Jan. 2010 estimates. So the expected state yield would be 171.0 bushels per acre and the ACRE price guarantee would be $3.88 per bushel.
2010 Iowa Corn ACRE Guarantee By formula, the ACRE revenue guarantee would be $597.13/acre 90% * $3.88/bu. * 171.0 bu./acre But the ACRE revenue guarantee can not change by more than 10% 2009 guarantee = $637.15/acre Allowed range is $572.05 to $699.17 So 2010 proj. guarantee is $597.13/acre