Understanding the Periodic Table: History, Elements, and Trends
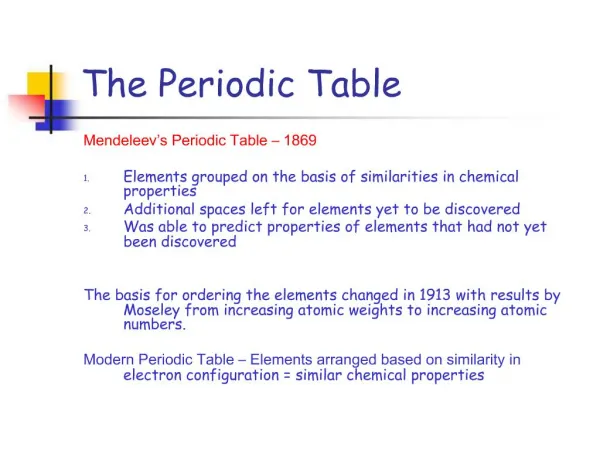
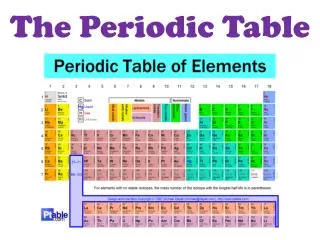
The Periodic Table, created by Dmitri Mendeleev in 1869, consists of 88 known elements, classified into metals, nonmetals, and metalloids. Metals, the largest group, exhibit traits like luster and high conductivity. Nonmetals, predominantly on the right, are brittle with low density. Metalloids possess mixed properties. Trends in electronegativity and ionization energy are essential for understanding element behavior, with electronegativity increasing toward fluorine and ionization energy rising across periods. This guide illustrates the fundamental principles and classifications within the Periodic Table.


Understanding the Periodic Table: History, Elements, and Trends
E N D
Presentation Transcript
The Periodic Table Antonio & Kevin
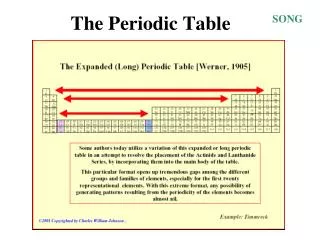
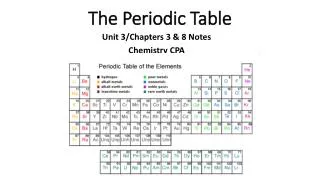
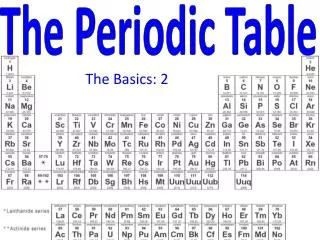
History • Created by Dmitri Mendeleev • 1869 • Intent of table to illustrate trends of the elements • At point of conception had a total of 63 elements
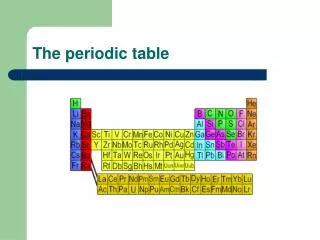
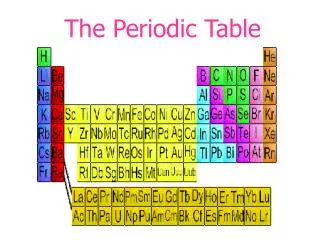
Metals • The metal Classification is largest on Periodic table • Shown in green • 88 elements in total • Classifications: • Luster • Good conductors of heat and electricity • High density • High melting point • Ductile • Malleable
Nonmetals • 17 elements • Mostly on right side of PT, except for Hydrogen • Shown in Orange • Classifications: • No luster • Poor conductor of heat and electricity • Brittle • Not ductile • Not malleable • Low density • Low melting point
Metalloids • Shown on “Stair-Case” • Shown in Purple • Classifications: • Solids • Can be shiny or dull • Ductile • Malleable • Conduct heat and electricity
Period • Start from 1-7 going down horizontal • Each element in same period have same amount of electron shells
Electronegativity • Definition: Ability of an atom to attract electrons when the atom is in the compound • Elements get more electronegative when heading toward F(Fluorine) • Electronegativity values decrease from top to bottom within a group, for representative elements the values tend to increase from left to right across a period
Trends of Ionization • Definition: First ionization energy tends to decreases from top to bottom within a group and increase from left to right across a period • Cations are always smaller than the atoms they formed from, anions are always larger then the atoms they formed from