Cosmic Order: Law of Frequency of Error
Explore the Central Limit Theorem's beauty in statistical regularity and predictability. Learn how large samples reveal hidden patterns amidst chaos. Discover the impressive nature of sample means approaching a normal distribution.


Cosmic Order: Law of Frequency of Error
E N D
Presentation Transcript
I know of scarcely anything so apt to impress the imagination as the wonderful form of cosmic order expressed by the "Law of Frequency of Error". The law would have been personified by the Greeks and deified, if they had known of it. It reigns with serenity and in complete self-effacement, amidst the wildest confusion. The huger the mob, and the greater the apparent anarchy, the more perfect is its sway. It is the supreme law of Unreason. Whenever a large sample of chaotic elements are taken in hand and marshaled in the order of their magnitude, an unsuspected and most beautiful form of regularity proves to have been latent all along. - Sir Francis Galton, in Natural Inheritance (1889)
Central Limit Theorem Given: 1. The random variable x has a distribution (which may or may not be normal) with mean µ and standard deviation . 2. Samples all of the same size n are randomly selected from the population of xvalues.
Central Limit Theorem Conclusions: 1. The distribution of sample x will, as the sample size increases, approach a normal distribution. 2. The mean of the sample means will be the population mean µ. 3. The standard deviation of the sample means will approach n
Distribution of 200 digits from Social Security Numbers (Last 4 digits from 50 students) Figure 5-19
Distribution of 50 Sample Means for 50 Students Figure 5-20
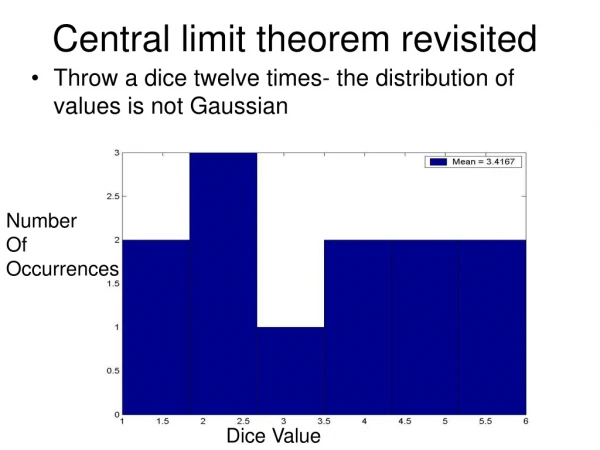
As the sample size increases, the sampling distribution of sample means approaches a normal distribution.
b) if 12 different men are randomly selected, their mean weight is greater than 167 lb.P(x > 167) = 0.7257 Example: Given the population of men has normally distributed weights with a mean of 172 lb and a standard deviation of 29 lb, a) if one man is randomly selected, find the probability that his weight is greater than 167 lb.P(x > 167) = 0.5675 It is much easier for an individual to deviate from the mean than it is for a group of 12 to deviate from the mean.