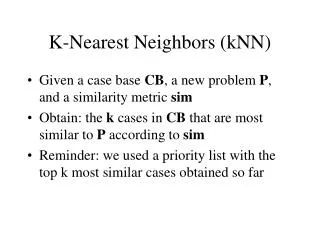
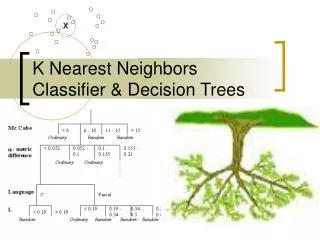
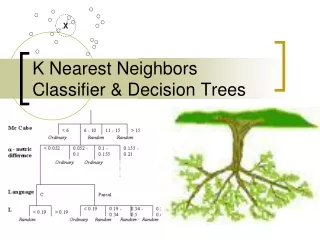
K-Nearest Neighbors
K-Nearest Neighbors. Nicolas Indelicato. K-Nearest Neighbors. Dataset Background How the Algorithm Works Optimizing the Algorithm Results Issues Summary. Dataset Background. Wine Dataset 13 Attributes

K-Nearest Neighbors
E N D
Presentation Transcript
K-Nearest Neighbors Nicolas Indelicato
K-Nearest Neighbors • Dataset Background • How the Algorithm Works • Optimizing the Algorithm • Results • Issues • Summary
Dataset Background • Wine Dataset • 13 Attributes • Alcohol, Malic Acid, Ash, Alcalinity of Ash, Magnesium, Total Phenols, Flavanoids, NonFlavanoid Phenols, Proanthocyanins, Color Intensity, Hue, OD280/D315 of Diluted Wines, Proline • Wide Range of Correlations • 2% in Ash to 83% in Flavanoids
Dataset Background Wine (continued) • 3 Classes • Class 1, Class 2, Class 3 wine • Attribute Weights • Nonflavanoid Phenols from 0.13 to 0.66 • Proline from 290 to 1680
Dataset Background • Iris Dataset • 4 Attributes • Sepal Length, Sepal Width, Petal Length, Petal Width • Range of Correlations • Sepal Width of 42% to Petal Lenth of 95% and Petal Width of 96% • 3 Classes • Iris-Setosa, Versicolor, and Virginica • Attribute Weights • Petal Width from 0.1 to 2.5 • Sepal Lentrh from 4.3 to 7.9
Dataset Background • Datasets include entities with similar attributes. • Determining the class cannot be done easily or quickly. • Descriptive Statistics is inefficient and cumbersome.
How the Algorithm Works • Instance-based • Used in classification and pattern recognition since the 1960s. • Minor training phase. • Customizable • Distance Method • k
How the Algorithm Works • K • Fixed constant • Determines number of elements to be included in each neighborhood. • Neighborhood determines classification • Different k values can and will produce different classifications
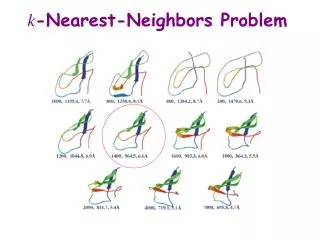
How the Algorithm Works • 1 Nearest Neighbor • Point xq classified as a “+” • 5 Nearest Neighbors • Point xq classified as a “-”
How the Algorithm Works • Euclidean Distance in n space. • ar(x) = rth attribute of instance x • xI and xJ represent two separate instances • Distance = Square Root of the Sum of the Squares.
Optimizing the Algorithm • Correlation • Does low correlation mean irrelevant attributes? • Missing values • Will missing values make the results erroneous? • Normalization • Will normalization of the attributes make the results more accurate? • Size • How efficiently does the algorithm classify data?
Results • Iris Dataset • Non-normalized • All attributes • Misclassification rate = 6% • 94% Accuracy • Setosa misclassified = 0/150 = 0% • Versicolor misclassified = 0/150 = 0% • Virginica misclassified = 9/150 = 6%
Results • Iris Dataset • Normalized • All attributes • Misclassification rate = 7.33% • 92.67% Accuracy • Setosa misclassified = 0/150 = 0% • Versicolor misclassified = 1/150 = 0.67% • Virginica misclassified = 10/150 = 6.67%
Results • Iris Dataset • Non-normalized • Petal Length and Petal Width • Misclassification rate = 4.67% • 95.33% Accuracy • Setosa misclassified = 0/150 = 0% • Versicolor misclassified = 0/150 = 0% • Virginica misclassified = 7/150 = 4.67%
Results • Iris Dataset • Normalized • Petal Length and Petal Width • Misclassification rate = 7.33% • 92.67% Accuracy • Setosa misclassified = 0/150 = 0% • Versicolor misclassified = 0/150 = 0% • Virginica misclassified = 11/150 = 7.33%
Results • Wine Dataset • Non-normalized • All attributes • Misclassification rate = 27.45% • 72.55% Accuracy • Class 1 wine misclassified = 7/153 = 4.58% • Class 2 wine misclassified = 23/153 = 15.08% • Class 3 wine misclassified = 12/153 = 7.84%
Results • Wine Dataset • Normalized • All attributes • Misclassification rate = 5.88% • 94.12% Accuracy • Class 1 wine misclassified = 0/153 = 0% • Class 2 wine misclassified = 9/153 = 5.88% • Class 3 wine misclassified = 0/153 = 0%
Results • Wine Dataset • Non-normalized • Phenols, Flavanoids, OD280/OD315 • Misclassification rate = 20.92% • 79.08% Accuracy • Class 1 wine misclassified = 1/153 = 0.65% • Class 2 wine misclassified = 31/153 = 20.26% • Class 3 wine misclassified = 0/153 = 0%
Results • Wine Dataset • Normalized • Phenols, Flavanoids, OD280/OD315 • Misclassification rate = 20.92% • 79.08% Accuracy • Class 1 wine misclassified = 2/153 = 1.31% • Class 2 wine misclassified = 30/153 = 19.61% • Class 3 wine misclassified = 0/153 = 0%
Issues • Nearest neighbors include equal amount of neighbors from two classes. • Classified into class with nearest neighbor.
Summary • Dataset Background • How the Algorithm Works • Optimizing the Algorithm • Results • Issues