Download
1 / 93
1.05k likes | 2.51k Vues
THE BEER INDUSTRY. AEM 4160. AGENDA . Industry Overview Major Players Primary Pricing Strategies Secondary Pricing Strategies Case Study Recommendations . INDUSTRY OVERVIEW. The Beer Industry. Why the Beer Industry?. Undergoing major changes Consolidation

E N D
THE BEER INDUSTRY AEM 4160
AGENDA. • Industry Overview • Major Players • Primary Pricing Strategies • Secondary Pricing Strategies • Case Study • Recommendations
INDUSTRY OVERVIEW. The Beer Industry
Why the Beer Industry? • Undergoing major changes • Consolidation • Uses pricing strategies that we have focused on in this class • Advertising • Bulk pricing • Beer is an interesting topic, specifically for college students
Industry Structure. Life Cycle Stage Regulation Level Revenue Volatility Technology Change Capital Intensity Barriers to Entry Industry Assistance Industry Globalization Concentration Level Competition Level Mature Heavy Medium Low High High Low Medium High Medium
Industry Revenue. Growth Year Revenue ($ million) Growth % 1998 33,162.2 ----- 1999 31,991.0 -3.5 2000 29,991.4 -6.3 2001 29,355.7 -2.1 2002 29,773.0 1.4 2003 31,275.5 5.0 2004 29,460.4 -5.8 2005 30,742.9 4.4 2006 31,163.0 1.4 2007 31,060.1 -0.3 2008 28,308.9 -8.9 2009 27,393.1 -3.2 2010 28,115.9 2.6 2011 28,783.5 2.4
Demand. • Continuously increases in industry • As time goes on and more people are of legal age, demand increases • Stable demand Beer prices are constant
Price and Non-Price Rivalry • Price Rivalry • No real price rivalry • Beer price increase due to inflation • Industry wide, not company specific • Also non-price based rivalry • Product innovations • Low calories, low carbs, etc.
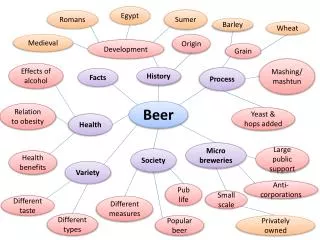
Product Differentiation. • Beer Style • Term used to differentiate and categorize beers • Companies use different styles to meet consumer preferences • Can vary depending on the color, flavor, strength, ingredients, production method, recipe, history, or origin of the beer • Companies offer different variations of core product
Innovation and Technology. • Technology advancements = increase in productivity • Reduction of inefficiencies • Increase operational effectiveness • The level of technology change is low
Capital Intensity. • The level of investment required is high
Government Regulation. • Bureau of Alcohol, Tobacco Firearms and Explosives (ATF) • US Alcohol and Tobacco Tax and Trade Bureau (TTB) • State regulations
Imports and Exports. • Anheuser-Busch InBev and MillerCoorsnow control 74.3% of total market share. • Exports = increased almost eightfold, from 1.3% of revenue in 2006 to an expected 11.3% in 2011. • Imports= 13.0% share of domestic demand in 2011, worth more than $3.8 billion, is above the 2006 import level of 11.3%. • Imports and exports continue increasing
Industry Trends. • Mergers have increased foreign ownership • International giant South African Breweries (SAB) acquired Miller Brewing Company to form SABMiller • Molson Canada merged with Coors Brewing Company in 2005 to form Molson Coors • Three years later, these companies launched MillerCoors, a joint venture of their operations within the United States • Combined market share= 29.0%
MAJOR PLAYERS. The Beer Industry
Anheuser-Busch InBev. • Market Share: 42.6% • Brand Names: Budweiser, Bud Light, Beck's, Stella Artois, Michelob, Natural Light, Leffe, Hoegaarden, O'Doul's
MillerCoorsLLC. • Market Share: 31.7% • Brand Names: Miller, Coors, Blue Moon, Mickey's, Pilsner Urquell, Foster's, Keystone, Milwaukee's Best , Steel Reserve, Killian's
PRICING STRATEGIES. The Beer Industry
PRIMARY PRICING STRATEGIES. • Collusion • Discounting • Sub-premium Emergence
Collusion of National Firms. • Collusion is an agreement made between firms to: • Divide Market Power • Set Prices • Limit Production • Lower Competition • Firms choose to collude in order to increase the overall profit margin of their respective firm.
WHY COLLUSION IS POSSIBLE. • Industry must be controlled by a few major firms. • A-B and MillerCoors control 80% of market share (Oligopoly). • Similar costs among top firms, with respect to production, advertising, etc. • Close to equal demand for product. • Similar Products.
COLLUSION ENABLES FIRMS TO: • Set prices relatively high. • Leads to increased Profit Margin. • Change price freely with minimal resistance. • Price will then, usually, only changes in a vertical direction. • Internally expand. • Leads to Economies of Scale.
AFFECT ON CONSUMERS. • Consumers must pay HIGHER OVERALL PRICE for products in this market. • This is the reason why a 12 pack of Miller Lite and Bud Lite are more expensive than most other brands in the same category. • Consumers choose beer depending on perceived benefits and qualities other than price.
REVENUE GROWTH. • Revenues, along with the Price Volatility of key brewing ingredients dropped due to expansion of the CRAFT BREWERY SEGMENT. • Profit increased as a percentage of revenue to 11.1% in 2011, compared to 10.8% of revenue in 2006.
DISCOUNT PRICING OR BULK PRICING. • Sell large quantities of beer at an attractive price. • Pay less per unit. • Requires consumer to trade down to sub-premium brands. • Second-Degree Price Discrimination.
SUB-PREMIUM SALES TRENDS. • 30 PACKS GREW 18.2% IN US DOLLAR SALES (2009). • 18 PACKS GREW 35.5% IN US DOLLAR SALES (2009). Source: Category Focus: 2010 Beer Report: Sub-premium, crafts lead the way
PREMIUM SALES TRENDS. • 30 PACKS GREW 6.4% IN US DOLLAR SALES (2009). • 36 PACKS GREW 15.8% IN US DOLLAR SALES (2009). Source: Category Focus: 2010 Beer Report: Sub-premium, crafts lead the way
WHY BUY IN BULK? • Consumers now realize that buying a large number of beers for a discounted price is efficient for our wallets. AND… • Buying in bulk is convenient, saving us both time and effort.
Shares of predicted annual sales by volume package size. 100% Percentage of Total Sales 50% 0% 72 OZ 144 OZ 288 OZ Package Size Source :RTI International, Research Triangle Park, NC, USA
BUYING IN BULK. • You can expect to pay about $11.99 for a 12-pack of 12-ounce cans at a typical grocery store • BUT, at Costco, a 30-pack of 12-ounce cans sells for $19.99! • About 67 cents per can versus about $1 per can at a supermarket. Source: MSN.com10 bulk-buying bargains
EMERGENCE OF SUB-PREMIUM BRANDS. • Several factors caused shift from premium brands towards sub-premium brands: • Current economy • Price of national premium brands held constant • Sub-premium dominate bulk market • Improved image of sub-premium brands • Perceived “coolness ALL LEAD CONSUMER TO TRADE DOWN!
BEER SALES & THE CURRENT ECONOMY. • As the unemployment rate has gone up, beer sales have plummeted at the exact same time. • Consumers more cost efficient. Source: IBIS World: Beer Production in the US
PREMIUM PRICES HELD CONSTANT. • A-B and MillerCoors have held prices constant and cut costs of production and marketing instead. • Consumers enticed to trade down to sub-premium level in order to save money
Top brands still dominate but consumers determine which segment is most popular. Source: Anheuser-Busch Companies, Inc.
IMPROVED IMAGE. • Keystone Light beer, the top share grower in the convenience store channel • Keystone recently embarked on National advertising campaign • Keith Stone Commercials • One of the most preferred drinks for college kids nationwide. • Keystone Light is a hot brand for beer drinkers looking for value in today's economy
OVERVEIW. • National brands able to manipulate price due to high market share • A-B and MillerCoors hold prices constant during recession. • Drops in sales and revenue • Consumers shifting towards buying in bulk to save money • Leads to a shift in preferred segment • Premium light Sub-premium light • Customers haven't stopped drinking. They just want to pay less for a buzz.
A WORD ON COMPETITION. How IS Competition Is Evolving Prices in the Domestic Beer Industry?
Increasingly Competitive! • Four largest corporations generate 81.8% of the revenue. • Same four corporations also produce 74.3% of all the beer in the United States. • However, domestic beer companies are facing increased competition. • High market concentration.