Download
1 / 1
10 likes | 130 Vues
A project to assemble a wind turbine system that supplies power to Coover Hall, reducing carbon footprint. LabVIEW interface displays currents, voltages, RPM, and powers. Components comply with regulations. Detailed testing procedures ensure proper functionality. Provides hands-on learning experience for students. Includes detailed project summary with comprehensive data. Acknowledgements to contributors and team members. Project website and contact information provided.

E N D
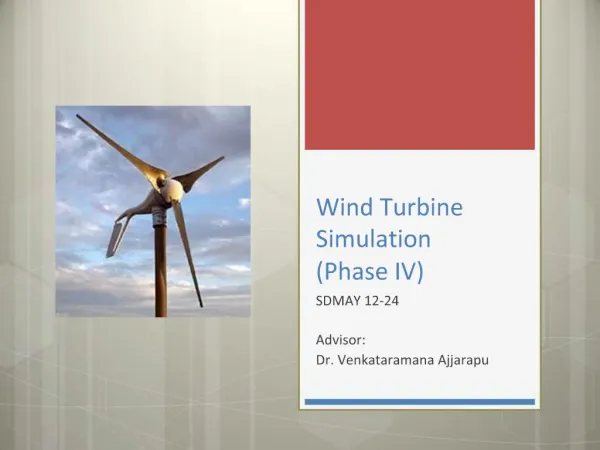
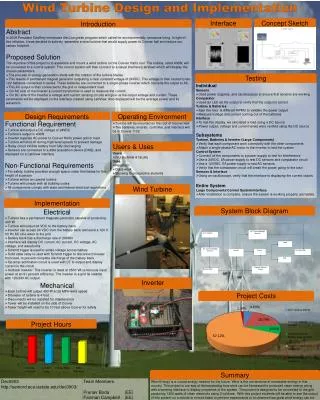
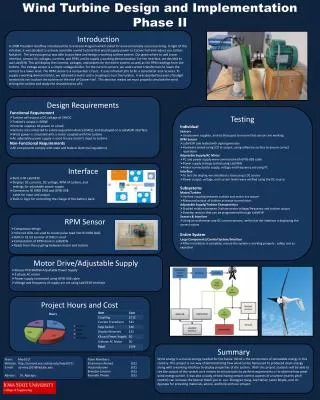
Wind Turbine Design and Implementation Phase II Introduction In 2008 President Geoffrey introduced the Live Green Program which called for environmentally conscious living. In light of this initiative, it was decided to actively assemble a wind turbine that would supply power to Coover hall and reduce our carbon footprint. The previous group was able to purchase and design a working turbine system. Our goals where to add a user interface, sensors for voltages, currents, and RPM, and to supply a working demonstration. For the interface, we decided to use LabVIEW. This will display the currents, voltages, and powers for the entire system, as well as the RPM readings from the turbine. The voltage sensor is a simple voltage divider. For the current sensors, we used current transformers to lower the current to a lower level. The RPM sensor is a comparator circuit.. It uses infrared LEDs to for a transmitter and receiver. To supply a working demonstration, we obtained a motor and a coupling to turn the turbine. It was decided because of budget constraints not to place the turbine on the roof of Coover Hall. This decision meant we must properly simulate the wind driving the turbine and study the characteristics of it. • Design Requirements • Functional Requirement • Turbine will output a DC voltage of 24VDC • Turbine’s output is 400W • Inverter supplies AC power to a load • Sensors are connected to a data acquisition device (DAQ), and displayed on a LabVIEW interface • Wind power is simulated with a motor coupled with the turbine • An adjustable power supply is used to vary motor’s input to turbine • Non-Functional Requirements • All components comply with state and federal electrical regulations • Testing • Individual • Sensors • Used power supplies, and oscilloscopes to ensure that sensors are working • RPM Sensor • LabVIEW side tested with signal generator • Hardware tested using LED at output, using reflective surface to ensure correct • operation • Adjustable Supply/AC Motor • PC and power supply were connected with GPIB-USB cable • Power supply settings tested using LabVIEW • Motor connected to supply, voltage and frequency set using PC • Interface • To test the display, we simulated a load using a DC source • Power output, voltage, and current levels were verified using the DC source • Subsystems • Motor/Turbine • Verified coupling between turbine and motor are secure • Measured output of turbine as motor turned rotor • Adjustable Supply/Turbine Characteristics • Studied relation between 3-phase motor voltage/frequency and turbine output • Develop relation that can be programmed through LabVIEW • Sensors & Interface • Using an multimeter and DC current sensors, verify that the interface is displaying the correct values • Entire System • Large Components/Control System/Interface • After installation is complete, ensure the system is working properly , safely, and as expected • Interface • Built in NI LabVIEW • Displays DC currents, DC voltage, RPM of turbine, and • settings for adjustable power supply • Connects to NI 6008 DAQ and GPIB-USB • cable for input and output • Built-in logic for controlling the charge of the battery bank • RPM Sensor • Comparator design • Infra red LEDs are used to create pulse read into NI 6008 DAQ • Built-in 32 bit counter of DAQ is used • Computation of RPM done in LabVIEW • Reads from the coupling between motor and turbine • Motor Drive/Adjustable Supply • Kikusui PCR 6000W Adjustable Power Supply • 3-phase AC motor • Power supply connected using GPIB-USB cable • Voltage and frequency of supply are set using LabVIEW Interface • Project Hours and Cost Summary Wind energy is a crucial energy needed for the future. Wind is the cornerstone of renewable energy in this country. This project is our way of demonstrating how wind can be harnessed to produced clean energy along with a working interface to display properties of the system. With this project students will be able to see the output of this system on a minute to minute basis to perform experiments or to observe how great wind energy can be. It was also a study of how having certain control aspects of a turbine (mainly pitch control) can increase the Special thank you to our Zhongjian Kang, Lee Harker, Jason Boyde, and Dr. Ajjarapu for providing materials, advice, and help with our project. Team: May1017 Website: http://seniord.ece.iastate.edu/may1017/ E-mail: sd-may1017@iastate.edu Advisor: Dr. Ajjarapu Team Members:Elsammani Ahmed (EE) Hassan Burawi (EE) Brandon Janssen (EE)Kenneth Thelen (EE)