Download

1 / 20
200 likes | 379 Vues
Wind Turbine Design and Implementation Phase III. Senior Design May 2011-01 Team Andrew Nigro (EE) Chad Hand (EE) Luke Rupiper (EE) Ryan Semler (EE) Shonda Butler (EE) Advisor: Venkataramana Ajjarapu. Problem Statement.

E N D
Wind Turbine Design and Implementation Phase III Senior Design May 2011-01 Team Andrew Nigro (EE) Chad Hand (EE) Luke Rupiper (EE) Ryan Semler (EE) Shonda Butler (EE) Advisor: VenkataramanaAjjarapu
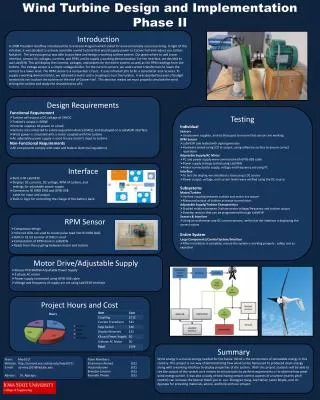
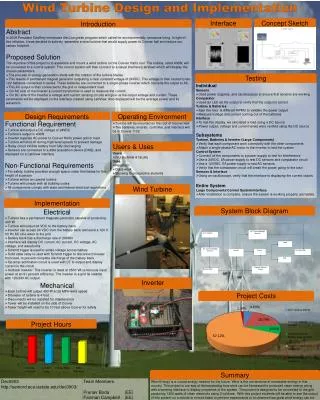
Problem Statement The objective of the senior design project is to simulate an environment in which a wind resource provides renewable energy. The electricity generated from the wind turbine can be used to power a direct load and potentially be integrated into the Iowa State University power grid.
System Block Diagram Overview of the Wind Power System
Operating Environment • Ideally would be mounted to the roof of a building • Controlled environment inside power lab in Coover • Wind simulation with AC motor controlled by LabVIEW • Input data provided by wind sensors
Requirements Functional • The turbine will generate a 24V DC output. • The turbine will generate a 400W peak output. • The test-bed connection will serve to simulate the load. • The motor will simulate outdoor wind speed. • The sensors to gather wind data will be an anemometer and wind vane. • The RPM sensor will accurately reflect the speed of the motor within ±5%. • The wind turbine will supply a load after charging the batteries to 23V. • The user interface will display accurate measurements of DC voltage and current, RPM, and real power produced. Non-Functional • The project will comply with all state and federal electrical regulations. • The turbine will be remounted to a new stable operating platform. • The project will be documented through technical manual and in-depth schematics. • Wiring and connections will be redone in a professional manner.
Assumptions & Limitations Assumptions: • The previous group has all equipment in working condition. For example, the coupling has not been damaged in testing. • The LabVIEW interface has been developed and tested to be accurate in displaying voltage, current, power and speed. • The senior design group working on designing the wind sensor will complete their objectives and will actively communicate any issues in receiving data. • The end product will be comparable to a regular connection to a classroom on the I.S.U. grid (120 V AC at 60 Hz). Limitations: • The budget of $400 leaves little room for any equipment malfunctions so our group must be completely knowledgeable of the system and its mechanical limitations. • The budget does not allow proper funding for field testing the equipment in its intended environment, mounted to the top of Coover Hall. • There is a lack of documentation (schematics, wiring diagrams, and system manual) of the previous group’s work. • Must wait for other senior design group we are working with to finish to begin testing.
Mounting & Platform • Old platform issues: • Stability • Vibration • Bowing • Materials: • 80/20 Inc. Rectangular Extruded Aluminum Rods • ¾”-1” slab of Medium Density Fiberwood • Round Rubber Gasket • Aluminum Plating • Cost Estimate: • $40-50 – Aluminum Rods • $10 – Aluminum plate • $25 – MDF platform • $5 – Rubber Gasket • 20$/hour Installation – 5 Hours • Standards • System grounding per NEC 250.52, item 5 and NEC 250.53, item A • OSHA 3095 Low Voltage Standards and Safety Bowing Strapped For Stability
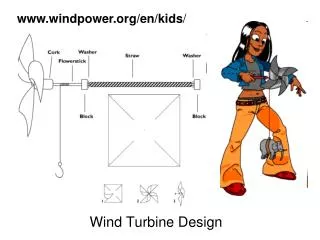
CAD Model Front View Full System View • Construction • Cut aluminum plating to cover faceplate of the turbine. • Cut extruded aluminum rods to match CAD measurements • Bolt motor to aluminum rods • Connect rods to faceplate to stabilize • L bracket brace 90 degree connections • Screw to MDF slab
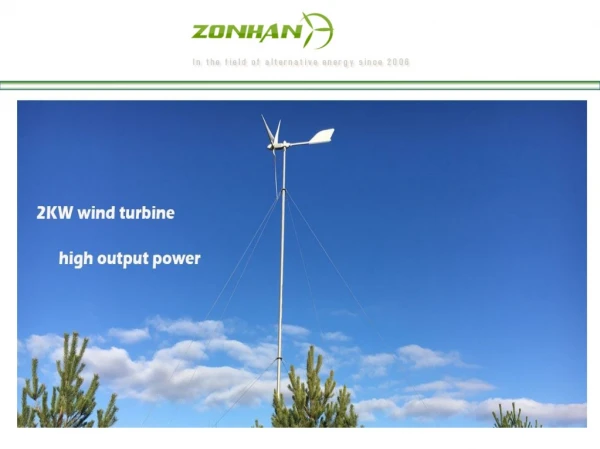
Wind Turbine & Inverter • Southwest Windpower AirX 400 Turbine • Designed to charge batteries • Minimum of 7V DC input to power on • Regulation Mode maximum 27V DC input • Wind input will be simulated through a coupled 3 phase motor • Outback GTFX2524 Inverter • 24V DC input • 120V AC output • Internal controller for stable output • Specifications are able to handle the 24V DC output from the turbine and the 120V AC, 10A load • Hybrid, stand-alone or grid connected modes
Sensors: Anemometer & Wind Vane • Data from wind sensors will be collected from a transceiver that we will be provided by Senior Design Team SD Dec10-05 • Wind profile data collected from a self-healing mesh network on the roofs of Coover and Durham • Each node in the network uses an anemometer, a wind vane, a microcontroller, and a wireless transceiver • Real-time data is averaged every 10 seconds in order to avoid excessively ramping the motor for short fluctuations • Sensors’ output transmitted through a transceiver with a range of 1-2 km • Transceiver output is passed through the microcontroller and then connected to our interface through USB • Microcontroller support software exports sensor data to a text file • Text file is imported into LabVIEW by analyzing each line as a string then passing this data to our LabVIEW interface • Text file is imported into Matlab using import wizard commands in our program to graph the wind profile
Sensors : CT & RPM • Hall effect current transducer • Powered by 12V DC power supply • Voltage divider gives safe voltage to DAQ • Calculate power from wind turbine • Calculate power to inverter
Hall Sensor Rpm Sensor Reed Sensor -Physical Switch -On/Off Digital Output -Fragile -Higher Cost -Magnetic Sensor -Linear analog output (generally) -Prepackaged Circuit -Lower Cost • - Digital Output • - Powered by DAC • Switching speed up to 10kHz • Prefabricated mounting holes • Long Leads
Motor Control • LabVIEW interface takes in text file from wind sensors and uses it for motor speed • Direct Control is our other option using Voltage regulation circuit given by Dr. Ajjarapu
Full System Testing Turbine Testing • On/Off testing. Spin turbine with hand while shorting and opening turbine leads to test breaking ability. • Battery Connection Testing. Connect appropriate leads to the terminals and observe if the indicator light turns on. • Rotation Response Testing. Spin the turbine with an electric drill. While keeping the system under 500RPM indicator light should be off. Set speed over 500RPM indicator light should come on which indicates power is being generated.
Full System Testing • Inverter Testing • 18V DC needed to operate – confirmed through multimeter, LEDs, and LabVIEW interface • Jumper connects to pins to make operational • LEDs show the status of the inverter Inverter Modes Courtesy of Outback
Conclusion • Current Project Status • Mounting parts are on order and construction can start immediately next semester • RPM Hall Sensor – chosen – waiting on approval • LabVIEW manual control of motor speed - completed • Programming LabVIEW for automatic motor control – in progress • Wind turbine, battery bank, and inverter operational testing – completed • Schematic of completed system – in progress • Website completed • Accurate retrieval of wind sensor data
Conclusion • Plans For Next Semester • Motor mount completely built by the first three weeks • Importing wind data files to LabVIEW & MATLAB • Model 24 hour wind profile on top of Coover Hall • Automated motor control based on wind profile • Load platform improvement • Technical manual
Project Members • Luke Rupiper – Project Leader • Motor Control lead • Andrew Nigro–Equipment Procurement Task Leader • Mounting and Construction lead • Shonda Butler – Communications Task Leader • Wind Sensor lead • Ryan Semler – Website Task Leader • RPM Sensor lead • Chad Hand – Documentation Task Leader • LabVIEW lead
Acknowledgements • Advisor: • Dr. Ajjarapu • Client: • Iowa State University Department of Electrical & Computer Engineering • Coover Hall Parts Department: • Leland Harker • Wind Sensor Design Team: • SDDEC10-05 • Senior Design Group: • SDDMAY10-17 • National Instrument Forums