Download
1 / 127
1.27k likes | 1.43k Vues
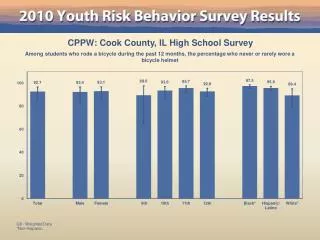
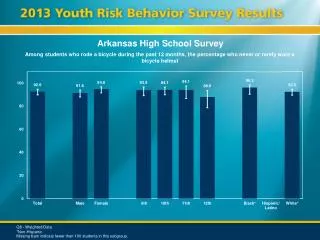
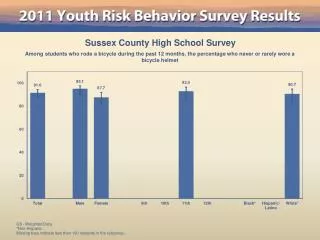
Sussex County High School Survey. Among students who rode a bicycle during the past 12 months, the percentage who never or rarely wore a bicycle helmet. Q8 - Weighted Data. *Non-Hispanic. Missing bars indicate less than 100 students in the subgroup. Sussex County High School Survey.

E N D
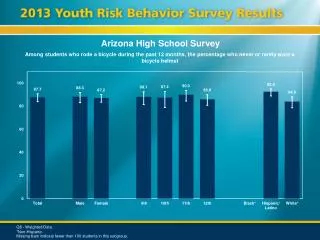
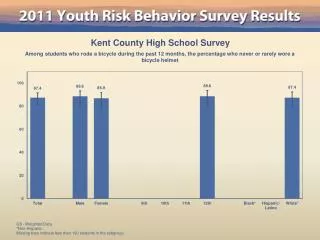
Sussex County High School Survey Among students who rode a bicycle during the past 12 months, the percentage who never or rarely wore a bicycle helmet Q8 - Weighted Data *Non-Hispanic. Missing bars indicate less than 100 students in the subgroup.
Sussex County High School Survey Percentage of students who never or rarely wore a seat belt when riding in a car driven by someone else Q9 - Weighted Data *Non-Hispanic. Missing bars indicate less than 100 students in the subgroup.
Sussex County High School Survey Percentage of students who rode one or more times during the past 30 days in a car or other vehicle driven by someone who had been drinking alcohol Q10 - Weighted Data *Non-Hispanic. Missing bars indicate less than 100 students in the subgroup.
Sussex County High School Survey Percentage of students who drove a car or other vehicle one or more times during the past 30 days when they had been drinking alcohol Q11 - Weighted Data *Non-Hispanic. Missing bars indicate less than 100 students in the subgroup.
Sussex County High School Survey Percentage of students who carried a weapon such as a gun, knife, or club on one or more of the past 30 days Q12 - Weighted Data *Non-Hispanic. Missing bars indicate less than 100 students in the subgroup.
Sussex County High School Survey Percentage of students who carried a gun on one or more of the past 30 days Q13 - Weighted Data *Non-Hispanic. Missing bars indicate less than 100 students in the subgroup.
Sussex County High School Survey Percentage of students who carried a weapon such as a gun, knife, or club on school property on one or more of the past 30 days Q14 - Weighted Data *Non-Hispanic. Missing bars indicate less than 100 students in the subgroup.
Sussex County High School Survey Percentage of students who did not go to school on one or more of the past 30 days because they felt they would be unsafe at school or on their way to or from school Q15 - Weighted Data *Non-Hispanic. Missing bars indicate less than 100 students in the subgroup.
Sussex County High School Survey Percentage of students who had been threatened or injured with a weapon such as a gun, knife, or club on school property one or more times during the past 12 months Q16 - Weighted Data *Non-Hispanic. Missing bars indicate less than 100 students in the subgroup.
Sussex County High School Survey Percentage of students who were in a physical fight one or more times during the past 12 months Q17 - Weighted Data *Non-Hispanic. Missing bars indicate less than 100 students in the subgroup.
Sussex County High School Survey Percentage of students who were in a physical fight one or more times during the past 12 months in which they were injured and had to be treated by a doctor or nurse Q18 - Weighted Data *Non-Hispanic. Missing bars indicate less than 100 students in the subgroup.
Sussex County High School Survey Percentage of students who were in a physical fight on school property one or more times during the past 12 months Q19 - Weighted Data *Non-Hispanic. Missing bars indicate less than 100 students in the subgroup.
Sussex County High School Survey Percentage of students who were ever hit, slapped, or physically hurt on purpose by their boyfriend or girlfriend during the past 12 months Q20 - Weighted Data *Non-Hispanic. Missing bars indicate less than 100 students in the subgroup.
Sussex County High School Survey Percentage of students who had ever been physically forced to have sexual intercourse when they did not want to Q21 - Weighted Data *Non-Hispanic. Missing bars indicate less than 100 students in the subgroup.
Sussex County High School Survey Percentage of students who had ever been bullied on school property during the past 12 months Q22 - Weighted Data *Non-Hispanic. Missing bars indicate less than 100 students in the subgroup.
Sussex County High School Survey Percentage of students who felt so sad or hopeless almost every day for two weeks or more in a row that they stopped doing some usual activities during the past 12 months Q24 - Weighted Data *Non-Hispanic. Missing bars indicate less than 100 students in the subgroup.
Sussex County High School Survey Percentage of students who seriously considered attempting suicide during the past 12 months Q25 - Weighted Data *Non-Hispanic. Missing bars indicate less than 100 students in the subgroup.
Sussex County High School Survey Percentage of students who made a plan about how they would attempt suicide during the past 12 months Q26 - Weighted Data *Non-Hispanic. Missing bars indicate less than 100 students in the subgroup.
Sussex County High School Survey Percentage of students who actually attempted suicide one or more times during the past 12 months Q27 - Weighted Data *Non-Hispanic. Missing bars indicate less than 100 students in the subgroup.
Sussex County High School Survey Percentage of students who made a suicide attempt during the past 12 months that resulted in an injury, poisoning, or overdose that had to be treated by a doctor or nurse Q28 - Weighted Data *Non-Hispanic. Missing bars indicate less than 100 students in the subgroup.
Sussex County High School Survey Percentage of students who ever tried cigarette smoking, even one or two puffs Q29 - Weighted Data *Non-Hispanic. Missing bars indicate less than 100 students in the subgroup.
Sussex County High School Survey Percentage of students who smoked a whole cigarette for the first time before age 13 years Q30 - Weighted Data *Non-Hispanic. Missing bars indicate less than 100 students in the subgroup.
Sussex County High School Survey Percentage of students who smoked cigarettes on one or more of the past 30 days Q31 - Weighted Data *Non-Hispanic. Missing bars indicate less than 100 students in the subgroup.
Sussex County High School Survey Percentage of students who smoked cigarettes on 20 or more of the past 30 days QNFRCIG - Weighted Data *Non-Hispanic. Missing bars indicate less than 100 students in the subgroup.
Sussex County High School Survey Among students who reported current cigarette use, the percentage who smoked more than 10 cigarettes per day on the days they smoked during the past 30 days Q32 - Weighted Data *Non-Hispanic. Missing bars indicate less than 100 students in the subgroup.
Sussex County High School Survey Among students who were less than 18 years of age and who reported current cigarette use, the percentage who usually got their own cigarettes by buying them in a store or gas station during the past 30 days Q33 - Weighted Data *Non-Hispanic. Missing bars indicate less than 100 students in the subgroup.
Sussex County High School Survey Percentage of students who smoked cigarettes on school property on one or more of the past 30 days Q34 - Weighted Data *Non-Hispanic. Missing bars indicate less than 100 students in the subgroup.
Sussex County High School Survey Percentage of students who ever smoked cigarettes daily, that is, at least one cigarette every day for 30 days Q35 - Weighted Data *Non-Hispanic. Missing bars indicate less than 100 students in the subgroup.
Sussex County High School Survey Among students who reported current cigarette use, the percentage who ever tried to quit smoking cigarettes during the past 12 months Q36 - Weighted Data *Non-Hispanic. Missing bars indicate less than 100 students in the subgroup.
Sussex County High School Survey Percentage of students who used chewing tobacco, snuff, or dip on one or more of the past 30 days Q37 - Weighted Data *Non-Hispanic. Missing bars indicate less than 100 students in the subgroup.
Sussex County High School Survey Percentage of students who used chewing tobacco, snuff, or dip on school property on one or more of the past 30 days Q38 - Weighted Data *Non-Hispanic. Missing bars indicate less than 100 students in the subgroup.
Sussex County High School Survey Percentage of students who smoked cigars, cigarillos, or little cigars on one or more of the past 30 days Q39 - Weighted Data *Non-Hispanic. Missing bars indicate less than 100 students in the subgroup.
Sussex County High School Survey Percentage of students who smoked cigarettes or cigars or used chewing tobacco, snuff, or dip on one or more of the past 30 days QNANYTOB - Weighted Data *Non-Hispanic. Missing bars indicate less than 100 students in the subgroup.
Sussex County High School Survey Percentage of students who had at least one drink of alcohol on one or more days during their life Q40 - Weighted Data *Non-Hispanic. Missing bars indicate less than 100 students in the subgroup.
Sussex County High School Survey Percentage of students who had their first drink of alcohol other than a few sips before age 13 years Q41 - Weighted Data *Non-Hispanic. Missing bars indicate less than 100 students in the subgroup.
Sussex County High School Survey Percentage of students who had at least one drink of alcohol on one or more of the past 30 days Q42 - Weighted Data *Non-Hispanic. Missing bars indicate less than 100 students in the subgroup.
Sussex County High School Survey Percentage of students who had five or more drinks of alcohol in a row, that is, within a couple of hours, on one or more of the past 30 days Q43 - Weighted Data *Non-Hispanic. Missing bars indicate less than 100 students in the subgroup.
Sussex County High School Survey Among students who reported current alcohol use, the percentage who usually got the alcohol they drank from someone who gave it to them during the past 30 days Q44 - Weighted Data *Non-Hispanic. Missing bars indicate less than 100 students in the subgroup.
Sussex County High School Survey Percentage of students who had at least one drink of alcohol on school property on one or more of the past 30 days Q45 - Weighted Data *Non-Hispanic. Missing bars indicate less than 100 students in the subgroup.
Sussex County High School Survey Percentage of students who used marijuana one or more times during their life Q46 - Weighted Data *Non-Hispanic. Missing bars indicate less than 100 students in the subgroup.
Sussex County High School Survey Percentage of students who tried marijuana for the first time before age 13 years Q47 - Weighted Data *Non-Hispanic. Missing bars indicate less than 100 students in the subgroup.
Sussex County High School Survey Percentage of students who used marijuana one or more times during the past 30 days Q48 - Weighted Data *Non-Hispanic. Missing bars indicate less than 100 students in the subgroup.
Sussex County High School Survey Percentage of students who used marijuana on school property one or more times during the past 30 days Q49 - Weighted Data *Non-Hispanic. Missing bars indicate less than 100 students in the subgroup.
Sussex County High School Survey Percentage of students who used any form of cocaine, including powder, crack, or freebase one or more times during their life Q50 - Weighted Data *Non-Hispanic. Missing bars indicate less than 100 students in the subgroup.
Sussex County High School Survey Percentage of students who used any form of cocaine, including powder, crack, or freebase one or more times during the past 30 days Q51 - Weighted Data *Non-Hispanic. Missing bars indicate less than 100 students in the subgroup.
Sussex County High School Survey Percentage of students who sniffed glue, breathed the contents of aerosol spray cans, or inhaled any paints or sprays to get high one or more times during their life Q52 - Weighted Data *Non-Hispanic. Missing bars indicate less than 100 students in the subgroup.
Sussex County High School Survey Percentage of students who used heroin one or more times during their life Q53 - Weighted Data *Non-Hispanic. Missing bars indicate less than 100 students in the subgroup.
Sussex County High School Survey Percentage of students who used methamphetamines one or more times during their life Q54 - Weighted Data *Non-Hispanic. Missing bars indicate less than 100 students in the subgroup.
Sussex County High School Survey Percentage of students who used ecstasy one or more times during their life Q55 - Weighted Data *Non-Hispanic. Missing bars indicate less than 100 students in the subgroup.
Sussex County High School Survey Percentage of students who took steroid pills or shots without a doctor's prescription one or more times during their life Q56 - Weighted Data *Non-Hispanic. Missing bars indicate less than 100 students in the subgroup.