Download
1 / 1
10 likes | 141 Vues
T. Pseudonana inoculation 24h culture. Control 24h exposure. BaP-treated 24h exposure. Harvest cells Extract protein : 60 µg per sample. Reduce, alkylate, digest Protein amount and digestion verified by SDS-PAGE. iTRAQ labeling 3 biological replicates 113 ; 115 ; 119.

E N D
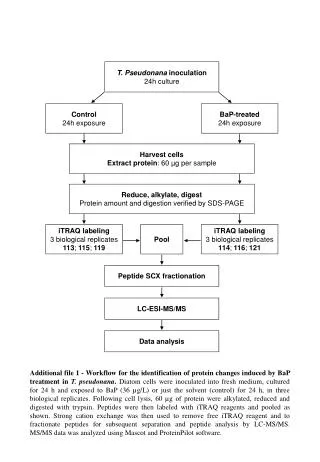
T. Pseudonana inoculation 24h culture Control 24h exposure BaP-treated 24h exposure Harvest cells Extract protein: 60 µg per sample Reduce, alkylate, digest Protein amount and digestion verified by SDS-PAGE iTRAQ labeling 3 biological replicates 113; 115; 119 iTRAQ labeling 3 biological replicates 114; 116; 121 Pool Peptide SCX fractionation LC-ESI-MS/MS Data analysis Additional file 1 - Workflow for the identification of protein changes induced by BaP treatment in T. pseudonana. Diatom cells were inoculated into fresh medium, cultured for 24 h and exposed to BaP (36 µg/L) or just the solvent (control) for 24 h, in three biological replicates. Following cell lysis, 60 µg of protein were alkylated, reduced and digested with trypsin. Peptides were then labeled with iTRAQ reagents and pooled as shown. Strong cation exchange was then used to remove free iTRAQ reagent and to fractionate peptides for subsequent separation and peptide analysis by LC-MS/MS. MS/MS data was analyzed using Mascot and ProteinPilot software.