
ABSTRACT
E N D
Presentation Transcript
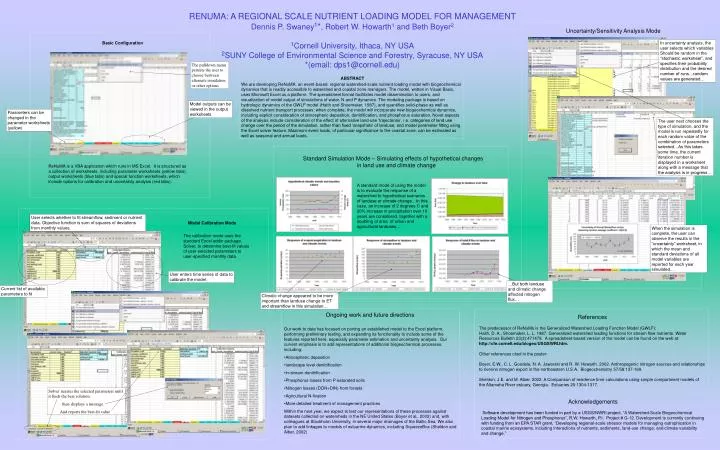
RENUMA: A REGIONAL SCALE NUTRIENT LOADING MODEL FOR MANAGEMENT Dennis P. Swaney1*, Robert W. Howarth1 and Beth Boyer2 1Cornell University, Ithaca, NY USA 2SUNY College of Environmental Science and Forestry, Syracuse, NY USA *(email: dps1@cornell.edu) Basic Configuration ReNuMA is a VBA application which runs in MS Excel. It is structured as a collection of worksheets, including parameter worksheets (yellow tabs), output worksheets (blue tabs) and special function worksheets, which include options for calibration and uncertainty analysis (red tabs). User enters time series of data to calibrate the model. Current list of available parameters to fit Ongoing work and future directions References The predecessor of ReNuMa is the Generalized Watershed Loading Function Model (GWLF): Haith, D. A., Shoemaker, L. L. 1987. Generalized watershed loading functions for stream flow nutrients. Water Resources Bulletin 23(3):471478. A spreadsheet-based version of the model can be found on the web at: http://cfe.cornell.edu/biogeo/USGSWRI.htm. Other references cited in the poster: Boyer, E.W., C. L. Goodale, N. A. Jaworski and R. W. Howarth. 2002. Anthropogenic nitrogen sources and relationships to riverine nitrogen export in the northeastern U.S.A. Biogeochemistry 57/58:137-169. Sheldon, J.E. and M. Alber. 2002. A Comparison of residence time calculations using simple compartment models of the Altamaha River estuary, Georgia. Estuaries 25:1304-1317. • Our work to date has focused on porting an established model to the Excel platform, performing preliminary testing, and expanding its functionality to include some of the features reported here, especially parameter estimation and uncertainty analysis. Our current emphasis is to add representations of additional biogeochemical processes, including: • Atmospheric deposition • landscape level denitrification • in-stream denitrification • Phosphorus losses from P-saturated soils • Nitrogen losses (DON+DIN) from forests • Agricultural N-fixation • More detailed treatment of management practices • Within the next year, we expect to test our representations of these processes against datasets collected on watersheds in the NE United States (Boyer et al., 2002) and, with colleagues at Stockholm University, in several major drainages of the Baltic Sea. We also plan to add linkages to models of estuarine dynamics, including SqueezeBox (Sheldon and Alber, 2002) Acknowledgements Software development has been funded in part by a USGS/NWRI project, “A Watershed-Scale Biogeochemical Loading Model for Nitrogen and Phosphorus”, R.W. Howarth, P.I. Project # G-12. Development is currently continuing with funding from an EPA STAR grant, “Developing regional-scale stressor models for managing eutrophication in coastal marine ecosystems, including interactions of nutrients, sediments, land-use change, and climate variability and change.” Uncertainty/SensitivityAnalysis Mode In uncertainty analysis, the user selects which variables Should be random in the “stochastic worksheet”, and specifies their probability distribution and the desired number of runs…random values are generated… The pulldown menu permits the user to choose between alternate simulation or other options ABSTRACT We are developing ReNuMA, an event-based, regional watershed-scale nutrient loading model with biogeochemical dynamics that is readily accessible to watershed and coastal zone managers. The model, written in Visual Basic, uses Microsoft Excel as a platform. The spreadsheet format facilitates model dissemination to users, and visualization of model output of simulations of water, N and P dynamics. The modeling package is based on hydrologic dynamics of the GWLF model (Haith and Shoemaker, 1987), and quantifies solid-phase as well as dissolved nutrient transport processes; when complete, the model will incorporate new biogeochemical dynamics, including explicit consideration of atmospheric deposition, denitrification, and phosphorus saturation. Novel aspects of the analysis include consideration of the effect of alternative land-use ‘trajectories’, i.e. categories of land use change over the period of the simulation, rather than fixed ‘snapshots’ of landuse, and model parameter fitting using the Excel solver feature. Maximum event loads, of particular significance to the coastal zone, can be estimated as well as seasonal and annual loads. Model outputs can be viewed in the output worksheets Parameters can be changed in the parameter worksheets (yellow) The user next chooses the type of simulation, and the model is run repeatedly for each random value of the combination of parameters selected…As this takes some time, the current iteration number is displayed in a worksheet along with a message that the analysis is in progress… Standard Simulation Mode – Simulating effects of hypothetical changes in land use and climate change A standard mode of using the model is to evaluate the response of a watershed to hypothetical scenarios of landuse or climate change…In this case, an increase of 2 degrees C and 20% increase in precipitation over 10 years are considered, together with a doubling of area of urban and agricultural landuses… User selects whether to fit streamflow, sediment or nutrient data. Objective function is sum of squares of deviations from monthly values. Model Calibration Mode When the simulation is complete, the user can observe the results in the “uncertainty” worksheet, in which the mean and standard deviations of all model variables are reported for each year simulated… The calibration mode uses the standard Excel addin package, Solver, to determine best-fit values of user-selected parameters to user-specified monthly data. …But both landuse and climatic change affected nitrogen flux… Climatic change appeared to be more important than landuse change to ET and streamflow in this simulation… Solver iterates the selected parameters until it finds the best solution, then displays a message And reports the best-fit value