Factorial Designs
Factorial Designs. 40. 12. Effect of A: 1 Effect of B: -9. B -. ←Factor B→. Response. B +. B +. B -. 20. 50. ←Factor A→. ←Factor A→. 30. 52. Effect of A: 21 Effect of B: 11. ←Factor B→. B +. Response. B +. B -. Factorial Design – all possible combinations

Factorial Designs
E N D
Presentation Transcript
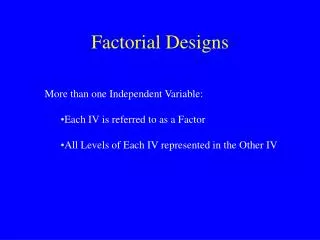
40 12 Effect of A: 1 Effect of B: -9 B- ←Factor B→ Response B+ B+ B- 20 50 ←Factor A→ ←Factor A→ 30 52 Effect of A: 21 Effect of B: 11 ←Factor B→ B+ Response B+ B- • Factorial Design – all possible combinations • Main Effect – Difference of average response • Interaction • Effect of one factor depends on the level of the other factor • Regression model • Introduce curvature into response surfaces & contour plot • Interactions can mask main effects B- 20 40 ←Factor A→ ←Factor A→
More Efficient – compared to 1-factor testing • More Informative – includes interactions
In general, a levels of factor A, b levels of factor B and n replicates requires abn tests. • Effects model () has terms for: • Effect of A • Effect of B • Effect of A-B Interaction • Error • 2 Factor ANOVA to establish significance of each term. • SST=SSA+SSB+SSAB+SSE • Each SS divided by it’s degree of freedom is a mean square (MS) • Expected value of each of the first 4 MS values is the sum of σ2 and the relevant effect • The last value, MSE, is all σ2. • If the relevant effect is significant, then the ratio of MS:MSE > 1 • Ratios of MS distributed as ‘F’ if everything is noise. • If the ratio is improbable then all is not noise. • So the ANOVA output contains a ‘P-Value’ for ‘Fo’ that should be less than 0.05 if we wish to consider the effect significant.
If the model should have terms for A, B, and AB, then n >= 2. • n also improves resolution (the difference in means can still be determined even if they are close together)
Three way (& more) interactions are possible, but unusual • Response surface can be more complex if more complex interactions are present.
Graphical Representations of the Model Response Surface Contour Plot