Factorial Designs - 1
Factorial Designs - 1. Intervention studies with 2 or more categorical explanatory variables leading to a numerical outcome variable are called Factorial Designs. A factor is simply a categorical variable with two or more values, referred to as levels .

Factorial Designs - 1
E N D
Presentation Transcript
Factorial Designs - 1 • Intervention studies with 2 or more categorical explanatory variables leading to a numerical outcome variable are called Factorial Designs. • A factor is simply a categorical variable with two or more values, referred to as levels. • A study in which there are 3 factors with 2 levels is called a 23 factorial Design.
Factorial Designs - 2 • If BLOCKING has been used it is counted as one of the factors. • Blocking helps to improve precision by raising homogeneity of response among the subjects comprising the block..
Factorial Designs - 3 Advantages of factorial Designs are: • A greater precision can be obtained in estimating the overall main factor effects. • Interaction between different factors can be explored. • Additional factors can help to extend validity of conclusions derived.
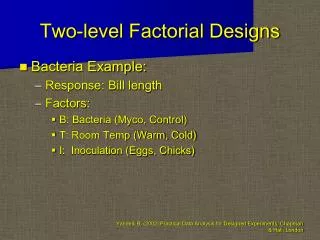
Analysis of Factorial Designs - 1 • Procedure used is General Linear Modelling. To compare the effects of different types of protein on growth laboratory mice were fed diets based on either cereal protein, or beef or pork. There were 20 mice in each group, half on a low quantity of the particular protein and half on larger quantity. Thus we have a study with 3 factors and 2 levels – a 23 Factorial Design.
Analysis of Factorial Designs - 2 • Factor Type Levels Values • Type PR fixed 3 1 2 3 • Lo/Hi fixed 2 1 2 • Analysis of Variance for Weight(g, using Adjusted SS for Tests • Source DF Seq SS Adj SS Adj MS F P • Type PR 2 266.5 266.5 133.3 0.58 0.561 • Lo/Hi 1 3168.3 3168.3 3168.3 13.90 0.000 • Error 56 12764.1 12764.1 227.9 • Total 59 16198.9 F statistic is not significant (P = 0.561) for Type of protein but significant (P = 0.000) for Amount of protein fed.
Analysis of Factorial Designs - 2 The main effects plot shows difference in weight gain with amount rather than type of protein
Analysis of Factorial Designs - 3 The lines cross. It means that there is interaction between the type of protein and the quantity fed. When the amount of protein fed is small, growth is better on cereal, but with larger quantities animal protein does better.
Multiple Regression Approach to Analysis of factorial Designs The regression equation is Weight (g) = 87.9 + 1.73 Cereal + 1.23 Beef + 7.27 Pork + 3.13 X1*X3+ 3.13 X2*X3 The above equation is obtained with effect coding