Bayesian Network Modeling for Evolutionary Genetic Structures
800 likes | 963 Vues
Bayesian Network Modeling for Evolutionary Genetic Structures. Lisa Jing Yan lisayan@cse.yorku.ca. Table of Contents. Part 1: Research Problem: Gene Selection Part 2: Research Methods: BN + AGenes Part 3: Conclusions. Part 1: Research Problem: Gene Selection. Gene Selection.

Bayesian Network Modeling for Evolutionary Genetic Structures
E N D
Presentation Transcript
Bayesian Network Modeling for Evolutionary Genetic Structures Lisa Jing Yan lisayan@cse.yorku.ca
Table of Contents • Part 1: Research Problem: Gene Selection • Part 2: Research Methods: BN + AGenes • Part 3: Conclusions
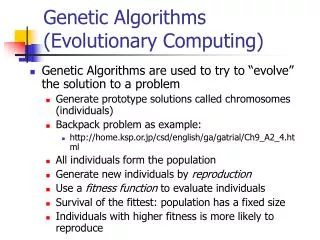
Gene Selection • Evolution forces genes to naturally change and adapt so organism can survive; called ‘natural selection’ in evolutionary biology • Takes millions of generations to measure and assess; change is gradual and genetically adapts organism to its environment
Gene Selection • Artificial genes (AGenes) can be created and quickly ‘evolved’ in an Artificial Life (AL) environment • Mimics evolution and determines rapidly which factors promote survival ‘fitness’ • How??
Genes are codes • Genetic information is a code representing characteristics of an organism or entity • Can be complex, with secret or hidden relationships between genes and gene combinations
Research Problem • Bayesian Network (BN) –----- (research bridge)------- Genetic Algorithm (GA) • Our Work: Evolutionary process can be analyzed using BN methods
Significance of Research • Reveal importance to use BN to analyze incomplete or complex data • Propose new utility and flexibility of GA-based AL, to provide dataset we need, not just optimized algorithm • Suggest important new applications for business world, and for biology
Research Design We propose to combine AL and BN: • Artificial Life means create a hypothetical simulation of the real world and behavior of real organisms, which could provide interesting data for BN analysis • BN graphically models data about the ‘best’ artificial genes which emerge from evolutionary simulation. This allows prediction about which genes are optimal to achieve certain desired goals
Research Steps Step 1: BN as an analytical tool (E-algorithm) Step 2: Develop GA based AL Model-ALGAE (Artificial Life Genetic Algorithm Expression):provide AGene Database Step 3: Develop BANANA (BAyesian Networks ANAlysis): Seek for hidden relationships among AGenes
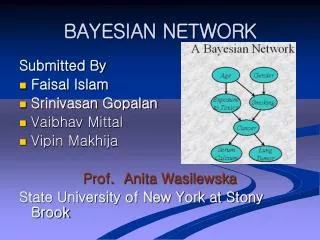
Why BN? • Why use BN? • Causal, bottom-up description of ‘wet grass’ model Rain? Sprinkler? Watson? Holmes?
BN Principles • BN describes dependency • BN reasoning connects events using probability and causation • Probability is conditional • Variables have degrees of dependence or independence
A B C E D F G BN Structure • Variables (nodes) and edges • Directed Acyclic Graph (DAG)
Joint Probability Distribution (JPD) In Bayesian networks, for each variable, the conditional probabilities are the set of parents which makethem independent of all other parents. After giving this specification, the joint probability distribution can be calculated by the product
How to Model BN? • BN learning has two main methods: • Constraint-based method: Perform tests of conditional independence (CI) on the data, and search for a network that is consistent with the observed dependencies and independencies . • Score-based method: Define a score that evaluates how well the dependencies in a structure match the data, and search for a structure that maximizes the score.
Pro. & Con. (Constraint Based) • Con. This approach is problematic since conditional independence relations are difficult to achieve with certainty. • Pro. However, Constraint based methods are more intuitive. They follow the definition of a BN more closely, also separate the notion of the independence from the structure construction.
Score Based • Define a score that evaluates how well the dependencies in a structure match the data, and search for a structure that maximizes the score. • the log-likelihood function • the MDL score. • Bayesian score (BDE Score) • They operate on the same principle: a scoring function is defined for each network structure, representing how well it fits the data.
Pro. & Con. (Score Based) • Con. Searching in a combinatorial space: Not clear how one can find the best-scoring network even with a scoring function. In general, the problem of finding the best-scoring network structure is NP-hard. • Pro. Less sensitive to errors in individual tests: Compromises can be made between the extent to which variables are dependent in the data and the cost of adding the edge.
Learning Limitations Limitations of both methods: (cf. improvements) • Too many tests required, thus costly and less efficient • Complex BN increases structure thus increases time-cost, NP hard
E-algorithm Design E-algorithm combines CI test and MDL metric search: • Uses CI initially + Improvement 1 • Combine MDL score and B&B searching + Improvement 2 Improvements are as follows:
Xk Xi Xj E-algorithm Improvements • order-0 & order-1 independence tests; • sort candidate parent nodes order, as heuristic information (cf. limitations)
Experiment Results • Benchmark ALARM (A Logical Alarm Reduction Mechanism) • A medical diagnostic system for patient monitoring: • 8 diagnoses • 16 findings • 13 intermediate factors
ALARM 37 Nodes, 46 arcs
Experiment Results • Our Results: 37 Nodes, 45 Arcs, structure as below:
Result Analysis Our structure has one redundancy(15->35) and two missing(8->36, 10->35)
Result Analysis • Possible reasons for the three problematic arcs are reasonable; since the possible attribute combination of all 37 variables, we use only 10000 record database rather than this enormous size and complexity: it is relatively small. • Our E-algorithm is feasible.
ALGAE 1 • ALGAE Goal: AGene Data Collection (used by BN for analysis) • Design: Develop ALGAE to mimic natural selection and create a dataset related to the selection of the best/fittest gene resulting from artificial evolution
ALGAE 2 • Experiment: based on using GA to develop AL competitive environment Why choose Artificial Life?
Why AL? • AL concept is based on Evolutionary Biology and AI. • Genes and chromosomes artificially emulate real organisms and living systems. • Goal is to survive through genetic fitness. • Can perform testing to speed up evolution time, and can control environment and create rules which control species in it.
Why GA? • Based on evolution and Darwinism’s natural selection (Gene Selection) and applies it to AL genes. • GA is adaptive search algorithm that improves and optimizes outcomes for each generation by building on previous, sub-optimal solutions. • Reaches best solution by learning as it goes along.
ALGAE Design - Frame A Simple Ecology System: • Certain resources (plant) exist, distributed in a two dimensional grid. • Two agents in this virtual world: Species 1 and Species 2. • Compete for resources to survive. • Certain behaviors, as: eat, mate, fight. • Ages increase until maximum, then natural death. • Barriers exist to constrict their movement.
ALGAE Design - Factors In ALGAE, we consider several aspects, such as: • Living environment (or lifespace) • Population • Food resources • Barriers • Competition • Behavior patterns & preferences • Physical status
ALGAE Design - AChromosome • Coding of artificial chromosomes using standard behaviors such as motion, contact with other individuals (either species) such as attack, mating, defense • Cf. the following table, showing 32-bit chromosome coded at start of run.
AChromosome Design 32-bit AChromosome Gi descriptor: [SP , SL , VF , TM , CM , LM , CA , CR , SA , DA , LA , EF]
AGenes - 1 [SP , SL , VF , TM , CM , LM , CA , CR , SA , DA , LA , EF] • SP (Species type): 0-species 1 / 1-species 2. • SL(Life span): Age =SL_MIN+SL. • VF (Vision field): 0:Area= 3×3; 1:Area=5×5; 2:Area=7×7; 3:Area=9×9;
Pattern1: Move randomly Pattern2: Move across Pattern3: Move diagonally AGenes - 2 [SP , SL , VF ,TM , CM , LM , CA , CR , SA , DA , LA , EF] • TM(Transition Movement):
AGenes - 3 [SP , SL , VF , TM ,CM ,LM ,CA , CR , SA , DA , LA , EF] • CM(Motion Characteristic): 1st: homogeneous biological motion (0: Neg./1: Pos.); 2nd: heterogeneous biological motion (0: Neg./1: Pos.); 3rd: food motion (0: Neg./1: Pos.). • LM (Motion Loss): Energy Loss=LM+1 . • CA (Action Characteristic): • CA simulates the biological drive for three different behaviors: 1. Attack 2. Hunting 3.Copulation. • It also describes behavioral preferences and their sequence, as follows:
AGenes - 4 [SP , SL , VF , TM , CM , LM ,CA ,CR , SA , DA , LA , EF] 1. Attack 2. Hunting 3.Copulation. • if CA =0/1/2; sequence:(1; 2; 3) • if CA =3; sequence:(1; 3; 2) • if CA =4; sequence:(2; 1; 3) • if CA =5; sequence:(3; 1; 2) • if CA =6; sequence:(2; 3; 1) • if CA =7; sequence:(3; 2; 1) • CR(Capricious Rate): • CR is the probability that individual does not comply with CM, species behavior (1;2;3). • However, individual may switch to another choice since fickleness is an implicit factor in any decision-making.
AGenes - 5 [SP , SL , VF , TM , CM , LM , CA , CR ,SA , DA , LA , EF] • SA • DA ALL Related to Fighting • LA • EF
ALGAE Run Process - 1 • Step 1: Initialize AWorld environment: • set up barriers and vegetative food supply; • Step 2: Initialize a population of AChromosomes randomly: • each individual i Energyi: (70,100), Agei :(0,SL_MIN); • Step 3: Evolutionary process start : • population of AChromosomes are ready to evolve; • Step 4: According to individuals’ AGene and status, certain activity is to command either “Move” or “Act”: • Move: change to another spot; • Act: any one of attack, eating, and mating Within individual’ vision field, no attractive thing or food exists, then individual can only choose to Move;
ALGAE Run Process - 2 • Step 5: Increase each individual Age 1; • if anyone’s Lifespan surpasses Max., then eliminate it from population, also use cadaver as animal food; • Step 6: Increase vegetative food Fresh Level 1; • eliminate the expired food supplies which have surpassed its Time Limit; • Step 7: Increase generation number 1; • if all species extinct or over Max. given Generation Number, then go to step 3, Loop.
ALGAE Business Model App. • ALGAE works also for two corporations who exist in competitive market conditions • Code into the corporate entity “genes” for certain marketing abilities and functions • Program imposes accelerated evolution on each business, mimics environment of real world conditions
Business App. • Results show ALGAE predicts best qualities of successful business • Allows business to plan ideal strategy for profitable operation • Strategy is based on understanding the precise factors which contribute to survival and success of the enterprise
Experimental run • Note that species have choice and that GA randomly assigns parameters for each generation and selects genes according to their fitness (ability to survive and adapt)
Results • Initial State: