Download
1 / 1
10 likes | 111 Vues
Figure 2. Rain rate-brightness temperature curve for the Auto-Estimator. Cumulonimbus T b =200 K. Cirrus T b =200 K.

E N D
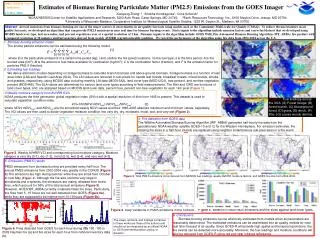
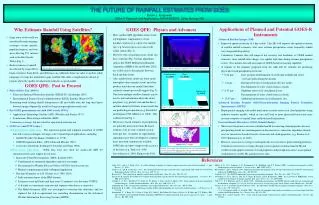
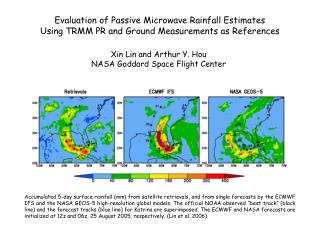
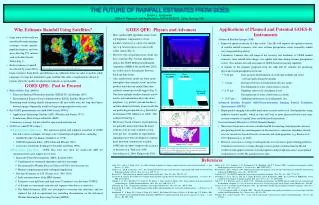
Figure 2. Rain rate-brightness temperature curve for the Auto-Estimator. Cumulonimbus Tb=200 K Cirrus Tb=200 K Figure 1. Comparison of precipitation estimates from radar (left) and satellite (right) over the Rio Grande Valley of Texas and northern Mexico, illustrating the limitations of radar coverage in this region. Nimbostratus Tb=240 K Figure 3. Illustration of the IR signal from different cloud types. Figure 4. An example of the relationship between ice water path (kg/m2; top left), cloud particle effective radius (m; top right) and radar rainfall rate (mm/h; bottom) at 2100 UTC 13 June 1999. THE FUTURE OF RAINFALL ESTIMATES FROM GOES Robert J. Kuligowski Office of Research and Applications, NOAA/NESDIS, Camp Springs, MD Applications of Planned and Potential GOES-R Instruments Why Estimate Rainfall Using Satellites? GOES QPE: Physics and Advances • Most satellite QPE algorithms relate cloud-top brightness temperature to cloud thickness and use it as a proxy for rainfall rate; e.g. heavier rain is associated with colder clouds (Fig. 2). • However, thin, nonraining cirrus clouds also have cold tops (Fig. 3).Some algorithms, such as the GOES Multispectral Rainfall Algorithm (GMSRA; Ba and Gruber 2001), use visible data to discriminate between thick and thin clouds. • Also, nimbostratus clouds are lower in the atmosphere than cumulus clouds and often produce much heavier rainfall than their relatively warm tops would suggest (Fig. 3). Data from multiple satellite channels can be used to infer information about the cloud properties (e.g. particle size and thickness) and thus identify relatively warm clouds that are producing precipitation (e.g. Rosenfeld and Gutman 1994; Miller et al. 2000). This is illustrated in Fig. 4. • Microwave-based estimates of precipitation are generally more robust than IR-based estimates, but are only available several times per day. A number of experimental algorithms have been developed to combine these data with continuously available GOES data in order to improve the accuracy of the latter (e.g. Turk et al. 1998; Sorooshian et al. 2000; Kuligowski 2002). • Large areas of the world are outside radar and raingauge coverage—oceans, sparsely populated regions, and even areas affecting U.S. interests such as the Rio Grande Valley (Fig. 1). • Radar estimates of rainfall are affected by range effects, • Advanced Baseline Imager (ABI) • Improved spatial resolution (0.5 km visible, 2 km IR) will improve the spatial resolution of satellite rainfall estimates--vital since extreme precipitation events frequently exhibit very sharp rainfall gradients. • Continuous 5-minute data will improve the accuracy and timeliness of GOES rainfall estimates, since rainfall rates change very rapidly with time during extreme precipitation events. Five-minute data will also improve GOES-based nowcasting capability. • A number of the channels proposed from the ABI will be valuable for producing physically-based precipitation retrievals: • 0.64 m – more accurate determination of cloud optical depth and cloud ice/water path during the daytime • 1.6 m – Daytime retrieval of cloud particle effective radius Discrimination of water clouds from ice clouds • 8.55 m -- Nighttime retrieval of cloud particle size Discrimination of water clouds from ice clouds • 10.35 m -- Additional information on cloud particle size. • Advanced Baseline Sounder (ABS)/Geosynchronous Imaging Fourier Transform Spectrometer (GIFTS) • Hyperspectral imaging will enable much more accurate retrieval of cloud properties using radiative transfer models, which in turn will lead to more physically-based and more accurate estimates of rainfall from visible/infrared information. • Geosyncrhonous Microwave (GEM) Sounder/Imager • Microwave frequencies are more suitable than IR for inferring cloud properties because precipitating clouds are semitransparent in the microwave; numerous algorithms already exist for microwave-based retrievals of rain rate and cloud properties (e.g. Ferraro et al. 1997; Kummerow et al. 2000). • However, microwave coverage is infrequent due to restriction to polar-orbiting platforms. Continuous microwave coverage (though at lower spatial resolution than the IR and visible) would support retrieval of cloud properties and precipitation rates via an optimal combination of visible, IR, and microwave data. beam overshoot, beam block, and differences in calibration from one radar to another, while raingauge coverage has tremendous gaps Satellite data offer a complimentary dataset in regions where the quality of radar-based estimates is questionable. GOES QPE: Past to Present • Polar-Orbiter Era (1960’s): • Television Infrared Observation Satellite (TIROS-IV) (Lethbridge 1967) • Environmental Science Service Administration (ESSA) Satellite (Barrett 1970) • Pioneering work relating rainfall information to IR and visible data, but long time lapses between imagesgenerally useful for long-term precipitation totals only. • Pre-GOES geostationary era (mid 1960’s-early 1970’s): • Applications Technology Satellite (ATS) (Woodley and Sancho 1971) • Synchronous Meteorological Satellite (SMS) • Continuous coverage, but not suited for operational real-time use. • GOES era (mid 1970’s-today): • Climatological applications: The improved spatial and temporal resolution of GOES data led to many techniques for large-scale / climatological applications, including • Griffith-Woodley Technique (Griffith et al. 1978); • GOES Precipitation Index, (GPI; Arkin and Meisner 1987); • Convective-Stratiform Technique (CST;Adler and Negri 1988). • Forecasting applications: GOES data were also ideal for small-scale QPE for operational forecaster support in real time: • Interactive Flash Flood Analyzer, (IFFA; Scofield 1987) • Combination of automated algorithms and forecaster input • Disseminated to Weather Forecast Offices (WFO’s) for forecaster use. • Manual component precluded widespread application. • The Auto-Estimator, or A-E (Vicente et al. 1999, 2001) • Fully automated most of the IFFA features • Estimates every half hour (and then every 15 minutes) over the entire CONUS • A-E tends to overestimate rain area and requires radar data as a corrective • The Hydro-Estimator (H-E) was developed to overcome this deficiency and has replaced the A-E in operational use, including dissemination on the Advanced Weather Information Processing System (AWIPS). References Adler, R. F., and A. J. Negri, 1988: A satellite infrared technique to estimate tropical convective and stratiform rainfall. J. Appl. Meteor., 27, 30-51. Arkin, P. A., and B. N. Meisner, 1987: The relationship between large-scale convective rainfall and cold cloud over the Western Hemisphere during 1982-84. Mon. Wea. Rev., 115, 51-74. Barrett, E. C., The estimation of monthly rainfall from satellite data. Mon. Wea. Rev., 98, 322-327. Ferraro, R. R., Special Sensor Microwave Imager derived global rainfall estimates for climatological applications. J. Geophys. Res., 102, 16715-16736. Griffith, C. G., W. L. Woodley, P. G. Grube, D. W. Martin, J. Stout, and D. N. Sikdar, 1978: Rain estimates from geosynchronous satellite imagery: Visible and infraredstudies. Mon. Wea. Rev., 106, 1153-1171. Lethbridge, M., 1967: Precipitation probability and satellite radiation data. Mon. Wea. Rev., 95, 487 490. Kuligowski, R. J., 2002: A self-calibrating real-time GOES rainfall algorithm for short-term rainfall estimates. J. Hydrometeor., 3, 112-130. Kummerow, C., Y. Hong, W. S. Olson, S. Yang, R. F. Adler, J. McCollum, R. Ferraro, G. Petty, D. B. Shin, and T. T. Wilheit, 2001: The evolution of the Goddard Profiling Algorithm (GPROF) for rainfall estimation from passive microwave sensors. J. Appl. Meteor., 40, 1801-1820. Miller, S. D., G. L. Stephens, C. K. Drummond, A. K. Heidinger, and P. T. Partain, 2000: A multisensor diagnostic satellite cloud property retrieval scheme. J. Geophys. Res., 105, 19955-19971. Rosenfeld, D., and G. Gutman, 1994: Retrieving microphysical properties near the tops of potential rain clouds by multi spectral analysis of AVHRR data. Atmos. Res., 34, 259-283. Scofield, 1987: The NESDIS operational convective precipitation technique. Mon. Wea. Rev., 115, 1773-1792. Sorooshian, S., K.-L. Hsu, X. Gao, H. V. Gupta, B. Imam, and D. Braithwaite, 2000: An evaluation of PERSIANN system satellite-based estimates of tropical rainfall. Bull. Amer. Meteor. Soc., 81, 2035-2046. Turk, F. J., F. S. Marzaon, and E. A. Smith, 1998: Combining geostationary and SSM/I data for rapid rain rate estimation and accumulation. Preprints, 9th Conf. On Satellite Meteorology and Oceanography, Paris, France, Amer. Meteor. Soc., 462-465. Vicente, G., R. A. Scofield, and W. P. Menzel, 1998: The operational GOES infrared rainfall estimation technique. Bull. Amer. Meteor. Soc., 79, 1883-1898. -----, J. C. Davenport, and R. A. Scofield, 2002: The role of orographic and parallax corrections on real time high resolution satellite rainfall distribution. Int. J. Remote Sens., 23, 221-230. Woodley, W. L., and B. Sancho, 1971: A first step toward rainfall estimation from satellite cloud photographs. Weather, 26, 279-289.