Peritoneal Dialysis Statistics 1997-2001: Trends and Analysis
530 likes | 559 Vues
This data set provides detailed statistics on peritoneal dialysis patients in Australia and New Zealand from 1997 to 2001, including patient distribution by age, primary renal disease, treatment outcomes, and more.

Peritoneal Dialysis Statistics 1997-2001: Trends and Analysis
E N D
Presentation Transcript
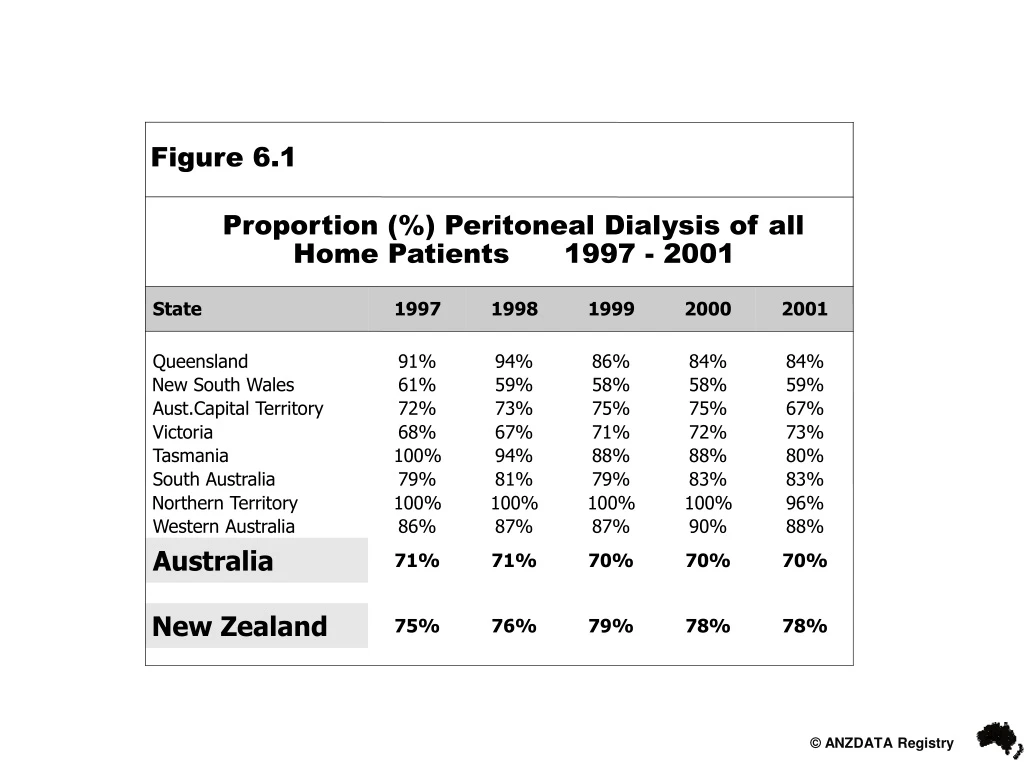
Figure 6.1 Proportion (%) Peritoneal Dialysis of all Home Patients 1997 - 2001 State 1997 1998 1999 2000 2001 Queensland 91% 94% 86% 84% 84% New South Wales 61% 59% 58% 58% 59% Aust.Capital Territory 72% 73% 75% 75% 67% Victoria 68% 67% 71% 72% 73% Tasmania 100% 94% 88% 88% 80% South Australia 79% 81% 79% 83% 83% Northern Territory 100% 100% 100% 100% 96% Western Australia 86% 87% 87% 90% 88% Australia 71% 71% 70% 70% 70% New Zealand 75% 76% 79% 78% 78%
Figure 6.2 Stock and Flow of Peritoneal Dialysis Patients 1997 - 2001 1997 1998 1999 2000 2001 Australia Patients new to PD 684 720 751 789 828 First Dialysis Treatment 390 399 414 425 483 Previous Dialysis (HD) 277 307 327 344 334 Failed Transplant 17 14 10 20 11 Transplanted 115 122 92 122 109 Deaths 268 296 309 289 310 Never Transplanted 258 286 293 280 299 Previous Transplant 10 10 16 9 11 Permanent Transfers Out (>12 ) 291 323 320 352 364 months Temporary Transfers (<12 ) 138 148 151 123 120 months Patients Dialysing at 31 December 1623 1619 1678 1737 1811 Patients Dialysing at Home 31 December 1572 1570 1623 1703 1769 % of all Home Dialysis Patients 71% 71% 70% 70% 70% New Zealand Patients new to PD 221 254 264 262 278 First Dialysis Treatment 129 158 177 142 178 Previous Dialysis (HD) 88 93 81 113 93 Failed Transplant 4 3 6 7 7 Transplanted 42 37 41 41 37 Deaths 96 105 98 139 135 Never Transplanted 92 100 93 138 132 Previous Transplant 4 5 5 1 3 Permanent Transfers Out (>12 ) 78 66 84 86 79 months Temporary Transfers (<12 ) 46 40 55 65 35 months Patients Dialysing at 31 December 578 634 671 680 711 Patients Dialysing at Home 31 December 571 627 665 676 702 % of all Home Dialysis Patients 75% 76% 79% 78% 78%
Stock and Flow of Peritoneal Dialysis PatientsAustralia 1995 - 2001 Number of Patients New Patients Transplants Perm. Transfer Deaths No. Dialysing 1811 Patients 95 96 97 98 99 00 01
Stock and Flow of Peritoneal Dialysis PatientsNew Zealand 1995 - 2001 Number of Patients New Patients Transplants Perm. Transfer Deaths No. Dialysing 711 Patients 95 96 97 98 99 00 01
Figure 6.5 Continuous Period of Peritoneal Dialysis at 31 March 2002 Months 0-6 7-12 13-18 19-24 25-30 31-36 37-42 43-48 49-60 61-72 73-84 85-96 97-108 >109 Australia 1st Treatment 12,701 Pts 3730 2507 1756 1253 1017 660 473 383 456 256 112 52 22 24 All Treatments 15,706 Pts 4854 3130 2129 1534 1187 788 565 448 522 300 126 61 28 34 New Zealand 1st Treatment 3,461 Pts 725 556 491 411 308 254 217 119 188 84 42 37 14 15 All Treatments 4,102 Pts 916 680 583 471 357 287 241 136 210 92 54 37 16 22
Age of New PD Patients No. Pats. 13 18 42 80 117 184 232 137 5
Age of Dialysing PD Patients No. Pats. 22 42 104 185 258 384 523 281 12
Figure 6.8 Stock and Flow of Peritoneal Dialysis 1997 - 2001 Age Groups 1997 1998 1999 2000 2001 New Patients H 00-14 years 19 (3%) 18 (2%) 16 (2%) 15 (2%) 13 (2%) 15-24 years 19 (3%) 19 (3%) 18 (2%) 26 (3%) 18 (2%) 25-34 years 47 (7%) 41 (6%) 39 (5%) 60 (8%) 42 (5%) 35-44 years 69 (10%) 69 (10%) 76 (10%) 67 (8%) 80 (10%) 45-54 years 101 (15%) 110 (15%) 122 (16%) 121 (15%) 117 (14%) 55-64 years 150 (22%) 151 (21%) 133 (18%) 179 (23%) 184 (22%) 65-74 years 208 (30%) 222 (31%) 244 (33%) 211 (27%) 232 (28%) 75-84 years 71 (10%) 88 (12%) 101 (13%) 104 (13%) 137 (17%) > 85 years 0 (0%) 2 (<1%) 2 (<1%) 6 (1%) 5 (<1%) Total 684 (100%) 720 (100% 751 (100%) 789 (100%) 828 (100%) Patients Dialysing 00-14 years 22 (1%) 29 (2%) 23 (1%) 25 (1%) 22 (1%) 15-24 years 44 (3%) 39 (2%) 44 (2%) 51 (3%) 42 (2%) 25-34 years 100 (6%) 90 (6%) 96 (6%) 113 (7%) 104 (6%) 35-44 years 176 (11%) 168 (10%) 159 (10%) 151 (9%) 185 (10%) 45-54 years 266 (16%) 258 (16%) 281 (17%) 281 (16%) 258 (14%) 55-64 years 335 (21%) 334 (21%) 340 (20%) 356 (20%) 384 (21%) 65-74 years 498 (31%) 501 (31%) 500 (30%) 513 (30%) 523 (29%) 75-84 years 180 (11%) 195 (12%) 228 (14%) 235 (14%) 281 (16%) > 85 years 2 (<1%) 5 (<1%) 7 (<1%) 12 (<1%) 12 (<1%) Total 1623 (100%) 1619 (100%) 1678 (100%) 1737 (100%) 1811 (100%) Primary Renal Disease H Glomerulonephritis 218 (32%) 221 (31%) 221 (29%) 222 (28%) 212 (26%) Analgesic Nephropathy 48 (7%) 52 (7%) 60 (8%) 54 (7%) 50 (6%) Hypertension 85 (12%) 88 (12%) 72 (10%) 106 (13%) 124 (15%) Polycystic Disease 38 (6%) 41 (5%) 34 (5%) 42 (5%) 27 (3%) Reflux Nephropathy 37 (5%) 31 (4%) 25 (3%) 39 (5%) 24 (3%) Diabetic Nephropathy 169 (25%) 177 (25%) 219 (29%) 204 (26%) 239 (29%) Miscellaneous 44 (6%) 62 (9%) 69 (9%) 68 (9%) 90 (11%) Uncertain 45 (7%) 48 (7%) 51 (7%) 54 (7%) 62 (7%) Total 684 (100%) 720 (100%) 751 (100%) 789 (100%) 828 (100%) New patients receiving first peritoneal dialysis treatment H
Number (Per Million) PD Patients Australia 1997 - 2001
Number (Per Million) APD Patients Australia 1997 - 2001
Number (Per Million) PD Patients New Zealand 1997 - 2001
Number (Per Million) APD Patients New Zealand 1997 - 2001
Age of New PD Patients No. Pats. 6 12 15 29 48 71 71 24 2
Age of Dialysing PD Patients No. Pats. 10 24 41 65 130 198 171 65 7
Figure 6.19 NEW ZEALAND Stock and Flow of Peritoneal Dialysis 1997 - 2001 Age Groups 1997 1998 1999 2000 2001 New Patients H 00-14 years 4 (2%) 5 (2%) 5 (2%) 5 (2%) 6 (2%) 15-24 years 7 (3%) 9 (4%) 5 (2%) 4 (1%) 12 (4%) 25-34 years 10 (5%) 19 (8%) 11 (4%) 13 (5%) 15 (5%) 35-44 years 21 (9%) 21 (8%) 22 (8%) 24 (9%) 29 (10%) 45-54 years 46 (21%) 44 (17%) 56 (21%) 49 (19%) 48 (17%) 55-64 years 60 (27%) 82 (32%) 78 (30%) 80 (31%) 71 (26%) 65-74 years 63 (29%) 60 (24%) 61 (23%) 57 (22%) 71 (26%) 75-84 years 9 (4%) 13 (5%) 24 (9%) 29 (11%) 24 (9%) > 85 years 1 (<1%) 1 (<1%) 2 (1%) 1 (<1%) 2 (1%) Total 221 (100%) 254 (100%) 264 (100%) 262 (100%) 278 (100%) Patients Dialysing 00-14 years 12 (2%) 9 (2%) 8 (1%) 6 (1%) 10 (2%) 15-24 years 23 (4%) 23 (4%) 18 (3%) 17 (2%) 24 (3%) 25-34 years 41 (7%) 41 (6%) 39 (6%) 38 (6%) 41 (6%) 35-44 years 64 (11%) 71 (11%) 70 (10%) 66 (10%) 65 (9%) 45-54 years 131 (23%) 129 (20%) 136 (20%) 135 (20%) 130 (18%) 55-64 years 161 (28%) 179 (28%) 188 (28%) 202 (30%) 198 (28%) 65-74 years 121 (21%) 145 (23%) 164 (24%) 156 (23%) 171 (24%) 75-84 years 24 (4%) 34 (5%) 44 (7%) 56 (8%) 65 (9%) > 85 years 1 (<1%) 3 (<1%) 4 (1%) 4 (<1%) 7 (1%) Total 578 (100%) 634 (100%) 671 (100%) 680 (100%) 711 (100%) Primary Renal Disease H Glomerulonephritis 47 (21%) 45 (18%) 52 (20%) 60 (23%) 75 (27%) Analgesic Nephropathy 0 (0%) 1 (<1%) 1 (<1%) 0 (0%) 0 (0%) Hypertension 34 (16%) 37 (15%) 33 (13%) 39 (15%) 39 (14%) Polycystic Disease 8 (4%) 10 (4%) 15 (6%) 5 (2%) 14 (5%) Reflux Nephropathy 7 (3%) 9 (3%) 8 (3%) 12 (4.5%) 9 (3%) Diabetic Nephropathy 97 (44%) 124 (49%) 114 (43%) 105 (40%) 110 (40%) Miscellaneous 19 (9%) 15 (6%) 21 (8%) 29 (11%) 20 (7%) Uncertain 9 (4%) 13 (5%) 20 (7%) 12 (4.5%) 11 (4%) Total 221 (100%) 254 (100%) 264 (100%) 262 (100%) 278 (100%) New patients receiving first peritoneal dialysis treatment H
Australia 1998 - 2002 BMI <20
New Zealand 1998 - 2002 BMI <20
Australia 1998 - 2002 BMI 20 - 24.9
New Zealand 1998 - 2002 BMI 20 - 24.9
Australia 1998 - 2002 BMI 25 - 29.9
New Zealand 1998 - 2002 BMI 25 - 29.9
Australia 1998 - 2002 BMI 30
New Zealand 1998 - 2002 BMI 30
Figure 6.21 First PD Treatment to First Episode of Peritonitis Related to Age at Entry 1997 to 31-Dec-2001 Age Groups Survival All 00-14 15-34 35-54 55-64 65-74 > 75 Australia n=82 n=337 n=934 n=795 n=1119 n=517 n=3784 3 months 69 ± 5.2 51 88 ± 1.8 280 86 ± 1.2 750 85 ± 1.3 626 84 ± 1.1 836 85 ± 1.6 390 85 ± 0.6 2933 6 months 55 ± 5.8 34 78 ± 2.4 214 76 ± 1.5 577 74 ± 1.6 480 73 ± 1.4 638 74 ± 2.0 283 74 ± 0.8 2226 9 months 48 6.1 22 68 2.8 157 68 1.6 456 66 1.8 377 64 1.6 499 68 2.3 212 66 0.8 1723 ± ± ± ± ± ± ± 1 year 41 ± 6.3 19 63 ± 3.0 121 62 ± 1.8 351 60 ± 1.9 299 58 ± 1.7 403 61 ± 2.5 164 60 ± 0.9 1357 2 years 30 ± 6.6 6 42 ± 3.6 42 43 ± 2.1 125 40 ± 2.2 111 40 ± 1.9 157 39 ± 3.0 55 41 ± 1.0 496 3 years - 34 4.1 17 31 2.5 43 30 2.5 44 28 2.1 58 31 3.4 23 30 1.2 188 ± ± ± ± ± ± N. Zealand n=23 n=104 n=358 n=374 n=313 n=106 n=1278 3 months 64 ± 10.1 14 84 ± 3.6 85 85 ± 1.9 292 83 ± 1.9 299 85 ± 2.0 247 87 ± 3.3 84 84 ± 1.0 1021 6 months 35 10.4 6 74 4.5 60 70 2.5 219 68 2.5 225 72 2.6 184 75 4.5 60 70 1.3 754 ± ± ± ± ± ± ± 9 months - 63 ± 5.2 42 60 ± 2.7 171 55 ± 2.7 162 64 ± 2.9 151 69 ± 4.9 46 60 ± 1.5 577 1 year - 53 ± 5.7 29 51 ± 2.9 132 46 ± 2.8 118 57 ± 3.1 117 59 ± 5.7 31 52 ± 1.5 432 2 years - 28 ± 6.1 9 32 ± 3.0 42 31 ± 2.9 39 39 ± 3.4 47 30 ± 6.4 9 32 ± 1.6 146 3 years - 20 6.3 4 21 3.3 11 22 3.2 13 22 3.7 13 - 21 1.8 41 ± ± ± ± ± ± % Survival S.E. and Numbers at risk
First PD Treatment to First Peritonitis Related to Age at Entry 1997 - 2001 % Survival Australia Age Group
First PD Treatment to First Peritonitis Related to Age at Entry 1997 - 2001 % Survival New Zealand Age Group
First PD Treatment to First Peritonitis Related to Race Australia 1992-1996 Caucasoid 35-54 yrs 55-64 yrs 35-54 yrs 55-64 yrs Aboriginal/Torres St Maori/Pac Isl
First PD Treatment to First Peritonitis Related to Race Australia 1997-2001 Caucasoid 35-54 yrs 55-64 yrs 35-54 yrs 55-64 yrs Aboriginal/Torres St Maori/Pac Isl
First PD Treatment to First Peritonitis Related to Race New Zealand 1992-1996 Caucasoid 35-54 yrs 55-64 yrs Maori/Pac Isl 35-54 yrs 55-64 yrs
First PD Treatment to First Peritonitis Related to Race New Zealand 1997-2001 Caucasoid 35-54 yrs 55-64 yrs Maori/Pac Isl 35-54 yrs 55-64 yrs
Figure 6.24 First Home APD Treatment to First Episode of Peritonitis Related to Age at Entry 1997 to 31-Dec-2001 Age Groups Survival All 00-14 15-34 35-54 55-64 65-74 > 75 Australia n=58 n=119 n=221 n=145 n=192 n=88 n=823 1 month 79 ± 5.4 45 97 ± 1.7 112 97 ± 1.1 210 96 ± 1.6 134 94 ± 1.7 176 94 ± 2.5 80 95 ± 0.8 757 3 months 68 ± 6.2 35 85 ± 3.3 94 86 ± 2.4 174 85 ± 3.0 113 84 ± 2.7 147 86 ± 3.8 67 84 ± 1.3 630 6 months 57 ± 6.8 24 72 ± 4.3 68 74 ± 3.1 125 76 ± 3.8 77 74 ± 3.4 96 84 ± 4.1 45 74 ± 1.6 435 9 months 53 ± 7.1 21 61 ± 4.9 46 64 ± 3.6 87 69 ± 4.4 57 69 ± 3.7 71 80 ± 4.9 30 66 ± 1.8 312 1 year 47 ± 7.3 16 57 ± 5.2 34 57 ± 3.9 65 61 ± 4.9 35 64 ± 4.1 55 74 ± 5.9 26 60 ± 2.0 231 2 years - - 45 ± 4.5 22 - 45 ± 5.4 16 - 43 ± 2.5 67 N. Zealand n=21 n=26 n=39 n=25 n=16 n=11 n=138 1 month 86 ± 7.6 18 84 ± 7.1 22 95 ± 3.6 36 83 ± 7.6 19 100 ± 0.0 16 90 ± 9.5 8 90 ± 2.6 119 3 months 61 ± 10.7 12 76 ± 8.5 17 84 ± 6.0 31 83 ± 7.6 19 87 ± 8.9 12 68 ± 15.5 6 78 ± 3.6 97 6 months 28 ± 10.4 4 67 ± 9.7 13 78 ± 6.9 22 70 ± 9.5 16 87 ± 8.9 9 68 ± 15.5 5 67 ± 4.2 69 9 months - 61 ± 10.4 10 62 ± 8.9 14 70 ± 9.5 9 66 ± 14.3 6 - 58 ± 4.7 46 1 year - 54 11.2 7 62 8.9 12 - - - 52 5.0 32 ± ± ± % Survival ± S.E. and Numbers at risk
Figure 6.25 Causes of Technique Failure April 1996 to March 1999 Excluding Death, Transplantation, Recovery of Renal Function Australia New Zealand Causes of Technique Failure Primary Secondary Primary Secondary Recurrent/persistent peritonitis 332 10 98 2 Acute peritonitis 232 6 68 1 Tunnel/exit site infection 124 3 13 - Total Infective Complications 688 (41%) 19 (23%) 179 (45%) 3 (38%) Inadequate solute clearance 156 8 31 - Inadequate fluid ultrafiltration 130 8 29 - Total Dialysis Failure 286 (17%) 16 (20%) 60 (15%) - Dialysate leak 122 17 24 1 Catheter block 19 - 8 - Catheter fell out 8 - - - Hernia 57 5 6 - Abdominal pain 14 2 3 - Abdominal surgery 50 5 13 - Multiple adhesions 4 - 3 - Hydrothorax 3 - 2 1 Haemoperitoneum 2 1 - - Scrotal oedema 1 - - - Total Technical Failure 280 (17%) 30 (36%) 59 (15%) 2 (25%) Unable to manage self care 144 4 20 - Patient preference 270 13 79 3 Total Social Reasons 414 (25%) 17 (21%) 99 (25%) 3 (37%)
Figure 6.26 Causes of Technique Failure April 1999 to March 2002 Excluding Death, Transplantation, Recovery of Renal Function Australia New Zealand Causes of Technique Failure Primary Secondary Primary Secondary Recurrent/persistent peritonitis 250 8 88 4 Acute peritonitis 297 7 119 4 Tunnel/exit site infection 68 3 9 1 Total Infective Complications 615 (29%) 18 (17%) 216 (38%) 9 (31%) Inadequate solute clearance 293 12 114 6 Inadequate fluid ultrafiltration 170 12 38 3 Total Dialysis Failure 463 (21%) 24 (22%) 152 (26%) 9 (31%) Dialysate leak 151 21 45 8 Catheter block 33 1 4 - Catheter fell out 11 - 1 - Hernia 71 5 6 - Abdominal pain 8 2 2 - Abdominal surgery 55 3 14 1 Multiple adhesions - - 5 - Hydrothorax 2 - - - Total Technical Failure 331 (15%) 32 (29%) 77 (13%) 9 (31%) Unable to manage self care 184 10 29 1 Patient preference 563 25 105 1 Total Social Reasons 747 (35%) 35 (32%) 134 (23%) 2 (7%)
Figure 6.27 Causes of Technique Failure April 1996 to March 2002 Race Age Group Causes of Non Abor./ Technique Diab. Total Diab. Asian Torres Cauc. Maori Pac.Is. Other 19-54 > 55 Failure St.Isl. AUSTRALIA Infective 329 974 99 206 965 4 19 10 485 781 1303 37% 33% 32% 56% 32% 40% 35% 32% 35% 33% 34% Reduced Solute 83 366 37 17 384 - 6 5 193 247 449 9% 12% 12% 5% 13% - 11% 16% 14% 11% 12% Inadequate UF 74 226 24 25 244 1 5 1 105 189 300 8% 8% 8% 7% 8% 10% 9% 3% 7% 8% 8% Technical 100 512 43 52 507 1 3 6 218 390 612 11% 17% 14% 14% 17% 10% 6% 19% 16% 17% 16% Social 294 867 109 71 947 4 21 9 400 737 1161 33% 29% 35% 19% 31% 40% 39% 29% 29% 31% 30% Total 880 2945 312 371 3047 10 54 31 1401 2344 3825 NEW ZEALAND Infective 155 240 24 - 137 165 68 1 150 240 395 41% 40% 36% - 33% 47% 51% 50% 37% 45% 40% Reduced Solute 55 90 13 - 60 56 16 - 74 70 145 15% 15% 19% - 14% 16% 12% - 18% 13% 15% Inadequate UF 35 32 4 - 33 23 7 - 22 43 67 9% 5% 6% - 8% 6% 5% - 5% 8% 7% Technical 51 85 10 - 61 47 18 - 55 78 136 14% 14% 15% - 15% 13% 14% - 14% 15% 14% Social 81 152 16 - 129 63 24 1 103 99 233 21% 25% 24% - 31% 18% 18% 50% 25% 19% 24% Total 377 599 67 - 420 354 133 2 404 530 976
Relationship of Residual GFR to Kt/V Achieved Kt/V March 2002 Australia New Zealand Mean 1 SD Litres / week / 1.73m2
Relationship of Residual GFR to Creatinine Clearance Creatinine Clearance (Litres/Week) March 2002 Australia New Zealand Mean 1 SD Litres / week / 1.73m2
Relationship of Residual GFR to KT/VMarch 2002 Residual GFR KT/V (Total) + S.E < 1 ml / min 2.07 ± 0.02 Aust > 1 ml / min 2.12 ± 0.02 < 1 ml / min 2.08 ± 0.03 NZ > 1 ml / min 1.98 ± 0.03
KT/V Related to Volume of DialysateAustralia March 2002 Prescribed Achieved KT/V (Total) Dialysate Volume 1.8 > 1.8 56 L / week 206 (37%) 345 (63%) 70 L / week 210 (27%) 575 (73%) 416 920
KT/V Related to Volume of DialysateNew Zealand March 2002 Prescribed Achieved KT/V (Total) Dialysate Volume 1.8 > 1.8 56 L / week 91 (46%) 106 (54%) 70 L / week 130 (35%) 240 (65%) 221 346
PET D/P Creatinine at Four HoursNew PD Patients from 1-Oct-98
Peritoneal Transport Status New Patients 1-Oct-1998 to 31-Mar-2002
Patient Survival Related to Referral(HD Treatment at 90 days) 1998 to March 2002 Australia
Patient Survival Related to Referral(HD Treatment at 90 days) 1998 to March 2002 New Zealand
Patient Survival Related to Referral(PD Treatment at 90 days) 1998 to March 2002 Australia
Patient Survival Related to Referral(PD Treatment at 90 days) 1998 to March 2002 New Zealand
Patient Survival Related to Referral(All Dialysis at 90 days) 1998 to March 2002 Australia