Download
1 / 10
210 likes | 758 Vues
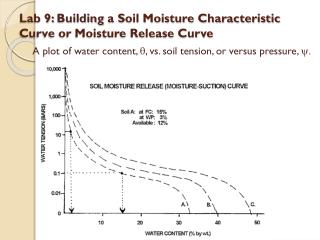
Lab 9: Building a Soil Moisture Characteristic Curve or Moisture Release Curve. A plot of water content, , vs. soil tension, or versus pressure, . We are Going to Create an Approximate Soil Moisture Characteristic Curve.

E N D
Lab 9: Building a Soil Moisture Characteristic Curve or Moisture Release Curve A plot of water content, , vs. soil tension, or versus pressure, .
We are Going to Create an Approximate Soil Moisture Characteristic Curve • A Moisture Characteristic Curve is a graph of the water content of the soil vs. the water tension in the soil. • We will estimate the soil moisture content at: • Saturation • Field Capacity • Air Dry • Oven Dry (which is equal to 0)
Oven Dry Air Dry Field Capacity Saturation
Water Content Calculations • Gravimetric WaterContent: • = Mass water / Mass Oven dry soil (g/g) • Volumetric Water Content: • = Volume water / Volume soil (cm3/cm3) • g (g/g) x BD (g/cm3) = (cm3/cm3) • Water Depth: • = v x Ds(Soil Depth)
Calculating Plant Available Water • PAW = v FC - vWP • The water in the soil between field capacity, = 0.1 bar, and the wilting point, = 15 bars: • The water bound less tightly than the field capacity is termed gravitational water because gravity easily drains this water before the plants can get it. • Water bound beyond the wilting point is unavailable, because plant roots can not pull hard enough to overcome absorption of the water to the soil
Saturated Water Content (0 bars) • Weigh cup and glass stir rod • Add 25g soil (nearest 0.01g) • Add water slowly • Reweigh • Gravimetric content at Sat. • Sat = Mass water/ mass dry soil
Field Capacity (0.1 bars) • 100 mL in graduated cylinder • 60 mL put a straw in • BD = g soil / cm3 • Pipette 10 mL water slowly • Parafilm/ 20 min • Mass soil wetted(g) = Vol. w. soil (cm3) x BD (g/cm3) • FC(g/g) = Mass water (g)/ Mass soil wetted(g)
Air-Dry and Oven-Dry • Air-Dry mass on the beaker • AD water % = (AD – OD)/ OD • Plot AD (1,000) • Plot OD (10,000): H2O content = 0
Estimate Pore Radius of Different Sands Using Capillary Rise • The wicking effect caused by small pores • h = 0.15 / r • h is the height of rise in tube, cm • r is the radius of pore size, cm • You are solving for “r” • The height of rise is higher in: • clays than silts • silts than sands • sands than gravels
Soil TensiometerUsed to measure soil tension (pressure)A pressure gage is connected to a water columnA porous ceramic cup lets water move, but not air Time Domain Reflectometer Used to measure soil moisture An electrical pulse is sent down the rod The pulse bounces off the end and returns to the source The wetter the soil, the longer the delay in returning