Download
1 / 65
650 likes | 675 Vues
Explore the latest tools and techniques in operational forecasting, including MOS output, ensembles, and downscaling methods. Learn about confidence intervals, gridded MOS products, and real-time data analysis for improved forecast accuracy. Discover how statistical methods can enhance forecast lead-time and precision.

E N D
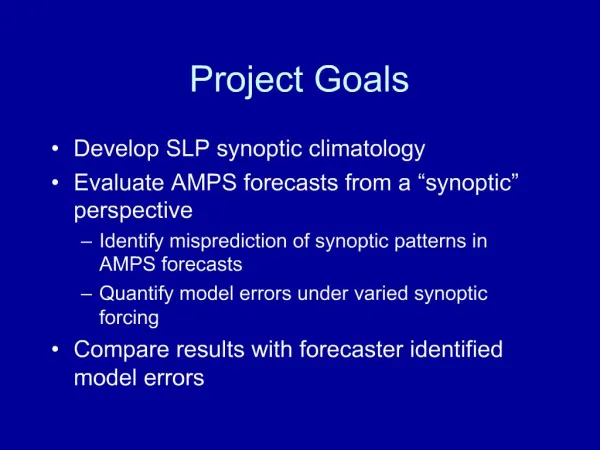
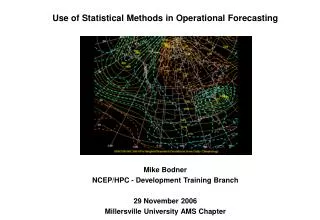
Use of Statistical Methods in Operational Forecasting Mike Bodner NCEP/HPC - Development Training Branch 29 November 2006 Millersville University AMS Chapter
Statistically based tools already used in operational forecasting… • MOS output ( > 30 years ) • Ensembles ( ~ 10-15 years ) • Short Range Ensemble Forecasts ( SREFs ~ 5-8 years )
Presentation Highlights • What’s New at HPC? • Standardized Anomalies • Identifying and Generating Teleconnections
New tools from HPC • Gridded Mos • Estimated confidence interval for QPF
NWS MOS System • Began in 1969 with distribution of 3 surface weather elements at 79 locations over the Eastern U.S. using multiple regression • In 1972 the first nationwide graphic product was introduced…generated from 200 point Probability of Precipitation (POP) forecasts • System expanded over the past several decades both geographically and into packages containing most surface weather variables from a variety of the NMC/NCEP models
Gridded MOS • Produce MOS guidance on high-resolution grid (2.5 to 5 km spacing) • Generate guidance with sufficient detail for forecast initialization at WFOs • Generate guidance with a level of accuracy comparable to that of the station-oriented guidance (downscaling)
Define “Downscaling” Producing site-specific forecasts or forecasts with higher spatial and/or temporal resolution than the output from the numerical weather prediction model on which the forecasts are based.
Examples of Downscaling • Simple … - climatology - persistence - interpolation - looking “upstream” • A bit more elegant … - time/space conversion - pattern correlation / teleconnections • Statistical … - perfect prog - MOS !!
Standard Text MOS Product Site specific forecast of temperature, dew point, winds and POPs
Gridded MOS Product 108 HR FCST Temperatures Over a 5km CONUS grid
Two ways to downscaling the NWP model to thereby better supporting the forecaster • “MOS at any point” Equations valid away from observing sites • Emphasis on high-density surface networks • Use high-resolution geophysical data • Analyze forecasts on high-resolution grid • “True” Gridded MOS • Observations and forecasts valid on fine grid • Use remotely-sensed predictand data
Observational data used in gridded MOS (GMOS) • METAR Data • Buoy data • Mesonet Data • NOAA cooperative network • RFC-supplied data
Geophysical Datasets 5 km Terrain 5 km Land Surface
Downscaling Process at HPC • Using PRISM data compute the difference between the 5 km grid and the PRISM data – left with 380 “delta” values between PRISM data and MOS stations • Create 5 km grid of delta values • Take grid of delta values then add it onto the PRISM data again
Realtime Gridded MOS can be found at… http://www.weather.gov/mdl/synop/gridded/sectors/index.php
Estimated confidence interval for QPF • Methodology developed to quantify uncertainty in HPC 6 hour QPF using SREFs • Probabilistic error forecasts and deterministic error forecasts produced • This pioneering work could aid in increasing the forecast lead-time and accuracy of RFC streamflow model forecasts • Methodology could have broader applicability and perhaps could be applied to other hydrometeorological parameters
Hypothesis – The larger spread in the SREF is greater than the uncertainty in HPC QPF To test this hypothesis – we investigated the relationship between HPC QPF Absolute Error (AE) several parameters available from the SREF • Computed the correlation between HPC QPF absolute error (AE) and SREF spread for 500 hPa heights – low correlation • Correlation between HPC QPF absolute error (AE) and SREF spread for 850 hPa RH – low correlation • Correlation between HPC QPF absolute error (AE) and SREF QPF spread – high correlation
Correlation Coefficient Variations with Forecast Hours(CC averaged for US) 2002 2003
On the basis of the high correlation between HPC QPF uncertainty and SREF QPF uncertainty ( > 0.5 for 90.5% of the grid points over the continental U.S. ) we can … • Use the SREF QPF uncertainty to predict the uncertainties of the HPC QPFs • By using regression model equation parameters (slope, intercept, MSE, number of data points and SREF QPF spread) derived at each grid point for each season and each individual forecast lead time, we can predict the HPC QPF error associated with an individual SREF QPF spread and the 95% confidence interval (CI) of the HPC error. • Based on the 95% CI of the HPC QPF error and HPC QPF we can also predict the 95% CI of the HPC QPF.
Schematic illustration of Confidence Interval (CI) ← Linear regression fit line HPC Error y = 2x + 1 50% CI → 95% CI → SREF Spread
Realtime data can be found athttp://www.hpc.ncep.noaa.gov/qpfci/qpfci.shtmlReferenceIm, Jung-Sun, K. Brill and E. Danaher, 2006: Confidence Interval Estimation for Quantitative Precipitation Forecasts (QPF) Using Short-Range Ensemble Forecasts (SREF). Weather and Forecasting, 21, 24-41.
Standardized anomalies is another valuable tool • Based on >50 years of climatology • Can be applied to a model forecast output • Fields can be compared to significant events from past dates • Can help evaluate model performance and trends
How are standardized anomalies generated? • Daily averages and standard deviations are computed for heights, temperatures, winds, moisture flux at various levels and precipitable water from NCAR/NCEP Reanalysis data 1948-2005 • Climatology is subtracted from the real time or case study data in question then divided by the standard deviation
Another way of looking at it using 500 hPa heights… Standard deviation or σ is computed by the following formula.. σ= square root of the average of heights 2 - average height2 The number of standard deviations from the climatology is computed by subtracting the 58 year average height from the model forecast or observed height then dividing by the standard deviation. Standardized Anomaly = (fcst height - average height) ÷ σ
When using this tool be mindful of … • The standard deviations or at least the SD pattern of the parameter of the data set for your forecast area • The climatological standard deviations vary seasonally and with latitude/longitude
Here’s an example of the computed standard deviations for 500 hPa heights forJuly 4. Notice how the variance increases proportionally with latitude. Also note how the largest standard deviations occur over the North Pacific and North Atlantic.
Let’s apply the SD data from the July 4 image in the previous slide… • At Atlanta, GA. The average 500 hPa height for July 4 is588 dm, and the standard deviation for 500 hPa height over Atlanta is3dm • A forecast value of 3 standard deviationsfrom normal or -3 would suggest a forecast height of 579 dm which is 9 dm below climatology • At Seattle, WA. The average 500 hPa height for July 4 is about 570 dm, and the standard deviation for 500 hPa height over Seattle is 9 dm • A forecast value of 3 standard deviationsfrom normal or -3 would suggest a forecast height of 543 dmor 27 dm below climatology.
The values plotted on the standard "bell curve" depict percent probability of a standard deviation being above or below the mean . Note, there is extremely low probability for forecast events greater than 3 standard deviations from climatology. Also note that temperature events trend slightly to the left or colder than the median.
Record Cold Northeast U.S 19-21 January 1994 Temperatures remained below zero for over 50 hours in Pittsburgh and many other sections of Pennsylvania, Ohio New York and New England during 19-21 January 1994. 500 hPa height fields for 19 January 1994 show a deep trough over eastern North America, but the significant departure from climatology as depicted by the standard deviation fields illustrated the extent of the low level cold air. Moreover fresh snow cover increased the potential for an exceptionally cold boundary layer.
Heavy precipitation events… • Hurricane Floyd – September 1999 • Fort Collins, CO Flash Flood – July 1997 • Blizzard of 1996 – January 1996
New England Heavy Rain Event Moisture Flux 850 Moisture Flux 850-700 Precipitable Water 0000 UTC June 27, 2006
When using standardized anomalies in the operational environment, always be mindful that… • It’s a statistical tool and not to be used to derive an analogue from a “similar” past event • Standardized anomalies are not a substitute for meteorological analysis, diagnosis and an informed forecast process • Extreme SD values can be a clue that a particular model may be going astray . • When applying standardized anomalies to temperature forecasting, keep in mind the effects of local boundary layer conditions (i.e. snow cover).
Resources To view standardized anomaly data in real time, go to http://www.hpc.ncep.noaa.gov/training/SDs/ To compute and display standard deviation for specific a specific date(s) over your CWA, the web site below is an excellent reference. http://www.hpc.ncep.noaa.gov/ncepreanal Additional significant cases, including several on a more national scale can be found at the reference and training web site for using standard deviations. The web address is http://www.hpc.noaa.gov/training If you have any questions or comments, please email mike.bodner@noaa.gov
Teleconnections* • Linkage between weather changes occurring in widely separated regions of the globe • Significant positive or negative correlation in the fluctuation of a field at widely separated points *AMS – Glossary of Meteorology
Teleconnections (500 hPa Heights) - PNA PNA - Positive PNA - Negative
Teleconnections Featuring Two Different Meteorological Parameters • Examine for correlation between parameters using standardized anomaly values • Derive an index to be used for classification and possible prediction.
200 hPa zonal wind and 500 hPa height • Let’s correlate 200 hPa u-winds in the climatological exit region of the East Asian Jet Stream (EAJS) and the high variance 500 hPa height regions over the Aleutian Isles and Eastern U.S. • Objective is to potential derive an diagnostic or predictive index