Download
1 / 21
220 likes | 432 Vues
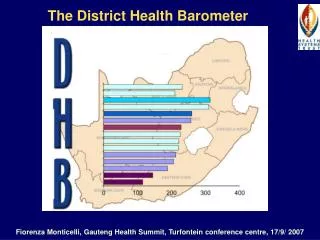
The District Health Barometer . Fiorenza Monticelli, Gauteng Health Summit, Turfontein conference centre, 17/9/ 2007. The data contained in the DHB comes directly from the DHIS, StatsSA, Treasury (BAS)* data and the national TB register or directly from the district / province .

E N D
The District Health Barometer Fiorenza Monticelli, Gauteng Health Summit, Turfontein conference centre, 17/9/ 2007
The data contained in the DHB comes directly from the DHIS, StatsSA, Treasury (BAS)* data and the national TB register or directly from the district / province . • None of the data values received have been changed and have merely been illustrated in graphs, maps and tables to make it easier to read for comparative purposes. Averages have been calculated, ie for the metro and ISRDP districts and PCE values calculated from the data received from Treasury. • The DHIS data is extracted at the end of June each year, once the official data set has been signed off by the provinces and sent to Treasury and the National Department of Health. • The data does not belong to HST, but to the DOH, StatsSA and Treasury, as applicable. Where the data is not publicly available, such as with the DHIS and Treasury data, HST have asked for and received written permission to use the data for each DHB published. • The purpose of the DHB is to portray the data as is, in order to highlight performance and / or data quality issues. Thus, if the data looks implausible - it merely highlights data quality issues at source. • * North West (Walker System)
Awareness • Increased awareness of : • data quality importance and issues • indicator use and interpretation of data • district performance • inadequate human resources in HIS • lack of capacity in HIS and the skillful use of information • Areas that need urgent attention
Deprivation index 2001 and Socio-economic quintiles
R232 Per Capita Expenditure 2005/06 R270 R249 R225 R199 R154 R199
Metsweding pop=207 774 is the most socio-economically deprived in Gauteng, 6% of households without access to piped water. • The only district without a district hospital in SA, 6 clinics and 2 mobile services (2005/6). • The primary health care expenditure decreased from R169 per capita in 2001/02 to R119 in 2005/6 and is the second lowest in SA. Inequitable when compared to Ekurhuleni at R270. • West Rand, pop=792 123, PCE dropped from R163 in 2001/02 to R154 per person. • 38 Clinics, 10 Mobile clinics, 2 district hospitals, hospital on R35 more per person than Metsweding.
Per Capita Expenditure 2006/07 R319 R307 R290 (Sneak preview) R221 R195 R167
Spider Graphs – a different way to view district performance The closer to the centre the better
SA ave = 90% Immunisation Coverage 2005/06 94.7% WR = 69.5 % Mtsw = 65.5%
What to expect in the DHB 2006/07 • Socioeconomic data • Population, Access to water, updated Deprivation Index using GHS 2005, poverty rate and socio-economic quintiles • Financial data • Health indicators - 3 financial years • New indicator – Supervision rate • District hospital data (by nr of beds 0-49, 50-99, 100-149, 150-200, 200+) • Average length of stay • Bed utilisation rate • Caesarean section rate • Cost per patient day equivalent • District profiles • Web-GIS interface
DHB 2006/07 • Release the final draft October/November 2007, • Raw data table will be made available to NDHSC members on CD to scrutinize and work with • Launch of hard copy publication and CD with data early February 2008