Download

1 / 82
820 likes | 1.01k Vues
RAAS Modulation: Novel Strategies for Reducing Cardiovascular Risk. Epidemiology/Guideline Update:. The diabetes crisis CVD and the aging patient. CHD risk rises sharply in middle age. NHANES 1999–2002. 20. 16.8. 15. 11.6. 11.5. 10.3. % Population. 10. 6.3. 5. 3.6. 3.0.

E N D
RAAS Modulation: Novel Strategies for Reducing Cardiovascular Risk
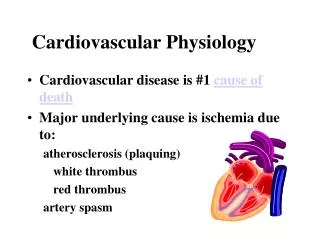
Epidemiology/Guideline Update: • The diabetes crisis • CVD and the aging patient
CHD risk rises sharply in middle age NHANES 1999–2002 20 16.8 15 11.6 11.5 10.3 % Population 10 6.3 5 3.6 3.0 1.6 1.4 0.3 0.2 0.0 0 20–34 35–44 45–54 55–64 65–74 ≥75 Age Women Men AHA. Heart Disease and Stroke Statistics—2005 Update.
CV disease: Leading cause of death in Americans 493,623 500 433,825 400 Men Women 288,768 300 268,503 Deaths (1000s) 200 100 69,257 64,103 60,713 41,877 38,948 34,301 0 C A D E C B A F E B E Diabetes C Accidents A Total CVD* F Alzheimer’s Disease B Cancer D Chronic lower respiratory diseases *CHD, stroke, HF, hypertension, arterial diseases Data compiled for 2002 CDC/NCHS and NHLBI.
Obesity and diabetes among US adults:Growing prevalence Obesity (BMI ≥30 kg/m2) Diagnosed diabetes +11.9% 30 +11.5% 8 6.5 6.6 6.6 6.4 24.3 5.9 25 6 23.9 23.7 23.0 Population (%) 21.8 20 4 15 2 0 0 2000 2001 2002 2003 2004* 2000 2001 2002 2003 2004* CDC. 2004 NHIS; www.cdc.gov/nchs/nhis.htm. *Jan–June
ACC/AHA 2002 Guideline Update for Management of Patients with Chronic Stable Angina: Asymptomatic patients Class Irecommendations for pharmacotherapy to prevent MI and death 1. Aspirin in the absence of contraindication in patients with prior MI (Level of evidence: A) 2. -Blockers as initial therapy in absence of contraindications in patients with prior MI (Level of evidence: B) 3. Lipid-lowering therapy in patients with documented CAD and LDL-C >130 mg/dL, with target LDL <100 mg/dL (Level of evidence: A) 4. ACEI in patients with CAD who have diabetes and/or systolic dysfunction (Level of evidence: A) Based on HOPE Gibbons RJ et al. J Am Coll Cardiol. 2003;41:159-68.
ACP recommendations for ACEI in chronic stable angina or asymptomatic CAD • To prevent MI or death and reduce symptoms in patients with chronic stable angina (Level of evidence: A) • To prevent MI and death in asymptomatic patients with: – Evidence of CAD and with systolic dysfunction (Level of evidence: A) – Diabetes with (Level of evidence: A) or without evidence of CAD (Level of evidence: B) Based on HOPE and EUROPA Snow V et al. Ann Intern Med. 2004;141:562-7.
RAAS: Central Role in the Pathogenesis ofCardiovascular Disease
RAAS: Sites of intervention with ACEIs, ARBs Atherosclerosis, hypertension Angiotensinogen Renin Angiotensin I ACE inhibitors Angiotensin-converting enzyme (ACE) Angiotensin II Angiotensin receptor blockers AT1 receptor AT2 receptor Vascular protection? Adapted from Nickenig G. Circulation. 2004;110:1013-20.
RAAS: Other potential sites of intervention Effects Aldosteroneendothelial function, thrombosisvascular compliance,baroreceptor function,fibrosis Cathepsin G Angiotensinogen Ang IIChymostatin-sensitive system Chymase Ang I Ang II ACE2 Ang I Ang (1–9), Ang (1–7) Struthers AD, MacDonald TM. Cardiovasc Res. 2004;61:663-70.Jacoby DS, Rader DJ. Arch Intern Med. 2003;163:1155-64. Zisman LS. Eur Heart J. 2005;26:322-4.
Ang II and mechanisms of atherosclerosis Endothelial dysfunction Inflammation Endothelial dysfunction IL-6 MCP-1 PDGF Lipid oxidation Impaired NO synthase LOX-1 Angiotensin II VCAM ICAM PAI-1 TF Thrombosis Adhesion TGF- Proliferation fibrosis Jacoby DS, Rader DJ. Arch Intern Med. 2003;163:1155-64.
PERTINENT: ACE inhibition NO via eNOS activity Controls CAD patients Baseline 1 Year P < 0.01* 4 3.5 P < 0.05† 3.3 2.9 3 2.5 2.4 eNOS activity in HUVECs(pmol/min/ mg protein) 2 1 0 Controls n = 45 Placebo n = 44 Perindopril n = 43 Placebo n = 44 Perindopril n = 43 * vs baseline † perindopril vs placebo PERindopril – Thrombosis, InflammatioN, Endothelial dysfunction and Neurohormonal activation Trial (substudy of EUROPA) HUVEC = human umbilical vein endothelial cell Ferrari R et al. www.europa-trial.org
AT1 receptor blockade improves flow-mediated vasodilation 122 Hypertensive patients treated for 2 months 2.5 * 2.0 FMD in brachial artery (%) * * 1.66 1.5 1.32 1.14 1.0 0.5 0.15 0.0 Placebo (n = 30) Losartan 100 mg (n = 31) Irbesartan 300 mg (n = 30) Candesartan 16 mg (n = 31) *P < 0.05 vs baseline and vs placebo Koh KK et al. Am J Cardiol. 2004;93:1432-5.
Ang II and mechanisms of atherosclerosis Inflammation Inflammation IL-6 MCP-1 PDGF Endothelial dysfunction Lipid oxidation Impaired NO synthase LOX-1 Angiotensin II VCAM ICAM PAI-1 TF Thrombosis Adhesion TGF- Proliferation fibrosis Jacoby DS, Rader DJ. Arch Intern Med. 2003;163:1155-64.
ACE inhibition reduces oxidative stress and inflammation 400 370 300 264 200 100 0 20 Patients with type 2 diabetes Lipid peroxides TNF- IL-6 4 3.3 * 2.9 3 * * 2.0 1.8 2 mol/L pg/mL 1 0 Perindopril 4 mg x 6 mos Baseline Marketou ME et al. J Am Coll Cardiol. 2005;45 (suppl A):396A. * P < 0.05 vs baseline
Ang II and mechanisms of atherosclerosis Lipid oxidation Adhesion Inflammation IL-6 MCP-1 PDGF Endothelial dysfunction Lipid oxidation Impaired NO synthase LOX-1 Angiotensin II VCAM ICAM PAI-1 TF Thrombosis Adhesion TGF- Proliferation fibrosis Jacoby DS, Rader DJ. Arch Intern Med. 2003;163:1155-64.
AT1, LOX-1 receptor cross-talk promotes adhesion molecule expression: Interaction between RAAS and dyslipidemia AT1 Scavengerreceptors?? Ang II Adhesion moleculeexpression ROS MAPKs MCP-1 NF-B PKs Monocyteattachment andactivation eNOS Endothelin Bad TNF- Fas DysfunctionApoptosisInjury Atherosclerosis Shearstress Endothelial cell LOX-1 OxLDL Mehta JL, Li D. J Am Coll Cardiol. 2002;39:1429-35.
Ang II upregulates LOX-1 expression via lipoxygenase pathway Human vascular smooth muscle cells * 400 ‡ 300 † LOX-1 mRNA 200 100 0 Ang II 10-7 mol/L+ Bai 10-5 mol/L Ang II 10-7 mol/L+ losartan 10-5 mol/L Control Ang II 10-7 mol/L * P < 0.0001 vs control † P < 0.0001 vs Ang II ‡ P < 0.05 vs Ang II Bai = baicalein (12-lipoxygenase inhibitor) Limor R et al. Am J Hypertens. 2005;18:299-307.
Ang II and mechanisms of atherosclerosis Proliferation fibrosis Inflammation IL-6 MCP-1 PDGF Endothelial dysfunction Lipid oxidation Impaired NO synthase LOX-1 Angiotensin II VCAM ICAM PAI-1 TF Thrombosis Adhesion TGF- Proliferation Jacoby DS, Rader DJ. Arch Intern Med. 2003;163:1155-64.
HOPE: Dose-dependent effects of ramipril on LV mass and function N = 446 follow-up, 4 years LV mass LV end-systolic volume 10 5.31 8.21 6 7.86 4 2.9 5 (g) (mL) 2 0 0 –4 –3.53 PTrend = 0.03 –1.9 –3 PTrend = 0.001 Ramipril 10 mg Placebo Ramipril 2.5 mg Lonn E et al. J Am Coll Cardiol. 2004;43:2200-6. Mean baseline LVEF 58%, all groups
LIFE: Greater reduction in LV mass with angiotensin receptor blockade vs beta-blockade Patients with hypertension and LVH Year Lastvisit 1 2 3 4 5 0 –10 Losartan 50–100 mg (n = 457) Atenolol 50–100 mg (n = 459) –20 Change inLV mass(g) –30 –40 P = 0.009 for all time points –50 Devereux RB et al. Circulation. 2004;110:1456-62.
Ang II and mechanisms of atherosclerosis Thrombosis Inflammation Endothelial dysfunction IL-6 MCP-1 PDGF Lipid oxidation Impaired NO synthase LOX-1 Angiotensin II VCAM ICAM PAI-1 TF Adhesion Thrombosis TGF- Proliferation fibrosis Jacoby DS, Rader DJ. Arch Intern Med. 2003;163:1155-64.
PAI-1 release: Differing effects of ACEinhibition vs AT1 receptor blockade 20 insulin-resistant, hypertensive patients treated for 6 weeks 15 10 Ramipril 10 mg 5 in PAI-1 antigen (ng/mL) Losartan 100 mg 0 –5 –10 –15 –20 1 3 4 6 Weeks Brown NJ et al. Hypertension 2002;40:859-65. P = 0.043, drug x time interaction
Change in PAI-1 antigen levels: Differing effects of ARBs 126 Patients with hypertension 80 P < 0.01 60 40 % Change 20 Candesartan 16 mg Irbesartan 300 mg 0 Losartan 100 mg Placebo –20 –40 P = 0.012 P = 0.163 Koh KK et al. Atherosclerosis. 2004;177:155-60.
tPA release: Differing effects of ACEinhibition vs AT1 receptor blockade 25 * 20 * P < 0.05 * * tPA antigen in coronary sinus (ng/mL) 15 * * 10 * 5 0 0 0.2 0.6 2.0 Bradykinin (g/min) Perindopril 4 mg (n = 16) Losartan 50 mg (n = 15) Control (n = 14) Matsumoto T et al. J Am Coll Cardiol. 2003;41:1373-9. *P < 0.05 vs baseline
Antiatherosclerotic effect of RAAS modulation: Clinical and experimental evidence • Studies in several animal models of atherosclerosis demonstrated reduced lesion progression with ACE inhibitor or AT1 receptor blocker1 • Regression of human carotid plaque demonstrated with ramipril (SECURE2), losartan (LAARS3), and fosinopril (PHYLLIS4) 1Jacoby DS, Rader DJ. Arch Intern Med. 2003;163:1155-64. 2Lonn E et al. Circulation. 2001:103;919-25. 3Ludwig M et al. Clin Ther. 2002;24:1175-93. 4Zanchetti A et al. Stroke. 2004;35:2807-12.
ARB blunts MMP expression in human carotid plaques: Potential role in plaque stabilization Carotid endarterectomy specimens 30 28.2 25.8 25.1 22.4 20 % Positive staining 10 7.2 6.2 5.8 5.6 0 MMP-2 MMP-9 COX-2 mPGES-1 P < 0.0001 all comparisons ARB = AT1receptor blockade MMP = matrix metalloproteinase Irbesartan Chlorthalidone Cipollone F et al. Circulation. 2004;109:1482-8.
Role of RAAS Modulation in CAD Patients
ACE inhibition in CAD: Short-term trials in acute MI Deaths (n)/Randomized (n) ACEI better Control better ACEI Control O-E Variance 192/3046(6.30%) 220/3044 (7.23%) 14.07 96.05 CONSENSUS-II* 650/9712(6.69%) 570/9682 (5.89%) –39.06 285.83 GISSI-3 2035/29,028 (7.01%) 2171/29,022(7.48%) –68.22 975.33 ISIS-4 676/7460 (9.06%) 317.85 –24.14 727/7489 (9.71%) CCS-1 Odds reduction (± SD) 7 ± 2 3501/49,214(7.11%) 3740/49,269(7.59%) 1675.06 –117.35 Total 0.5 0.75 1.0 1.25 1.5 Odds ratio (95% CI) Test for Heterogeneity: 2 5.8 (2p = 0.1) df = 3 Treat Eff: 2 (2p = 0.004) *IV infusion followed by oral therapy ACE Inhibitor MI Collaborative Group. Circulation. 1998;97:2202-12.
ACE inhibition in CAD: Long-term trials in post-MI LV dysfunction and HF P AIRE 0.002 27% 0.001 TRACE 22% SOLVD (Treatment) 0.0036 16% SOLVD (Prevention) 8% 0.30 0.019 19% SAVE 0 10 5 15 20 25 30 Risk reduction in total mortality (%) AIRE Study Investigators. Lancet. 1993;342:821-8. Køber L et al. N Engl J Med. 1995;333:1670-6. SOLVD Investigators. N Engl J Med. 1991;325:293-302. SOLVD Investigators. N Engl J Med. 1992;327:685-91. Pfeffer MA et al. N Engl J Med. 1992;327:669-77.
Aldosterone blockade and AT1 receptor blockade: Trials in post-MI/LV dysfunction or HF RALES EPHESUS 1.00 15% Risk reduction RR 0.85 (0.75–0.96) P = 0.008 22 30% Risk reduction RR 0.70 (0.60–0.82) P < 0.001 Placebo 0.90 18 Eplerenone 0.75 14 Cumulative incidence (%) Probability of survival Spironolactone 10 0.60 6 Placebo 0.45 2 0.00 0 6 12 18 24 30 36 0 18 0 6 12 24 30 36 Months Months VALIANT 0.4 2% RR V/C vs C HR 0.98 (0.89–1.09) P = 0.73) 0% RR V vs C HR 1.00 (0.90–1.11) P = 0.98 0.3 Valsartan Probability of event Captopril 0.2 Valsartan/captopril 0.1 Pitt B et al. N Eng J Med. 1999;341:709-17. Pitt B et al. N Eng J Med. 2003;348:1309-21. Pitt B et al. N Eng J Med. 2003;349:1893-906. 0.0 0 6 12 18 24 30 36 Months
HOPE, QUIET, EUROPA, PEACE: Primary outcomes EUROPA HOPE 14 Placebo Placebo 20 20% Risk reduction RR 0.80 (0.71–0.91) P = 0.0003 12 22% Risk reduction RR 0.78 (0.70–0.86) P = 0.001 10 15 Ramipril 10 mg 8 % Patients Perindopril 8 mg 6 10 4 5 2 0 0 2 3 5 0 1 4 1 2 3 4 0 Time (years) Time (years) PEACE QUIET 50 Quinapril 20 mg 30 4% Risk increase RR 1.04 (0.89–1.22) P = 0.6 4% Risk reduction HR 0.96 (0.88–1.06) P = 0.43 40 25 30 Trandolapril 4 mg 20 Placebo 20 % Patients Placebo 15 10 10 0 5 2 0 1 3 0 Time (years) HOPE Study Investigators. N Engl J Med. 2000;342:145-53. EUROPA Investigators. Lancet. 2003;362:782-8. PEACE Trial Investigators. N Engl J Med. 2004;351:2058-68. Pitt B et al. Am J Cardiol. 2001;87:1058-63. 1 2 3 4 5 6 Time (years)
HOPE, EUROPA: Consistency of treatment benefit Favors ACE inhibitor Favors Placebo Event rate (%) ACEIPlacebo 14.0 17.8 8.0 9.9 6.1 8.1 3.5 4.1 9.9 12.3 4.8 6.2 3.4 4.9 1.6 1.7 0.8 1.3 0.1 0.2 Composite outcome CV mortality Myocardial infarction Stroke Cardiac arrest HOPE(ramipril 10 mg) EUROPA(perindopril 8 mg) 0.5 1.0 1.5 Hazard ratio HOPE Study Investigators. N Engl J Med. 2000;342:145-53. EUROPA Investigators. Lancet. 2003;362:782-8.
HOPE, EUROPA: Concomitant CV therapy Added benefit No added benefit Lipid-lowering drug EUROPA No lipid-lowering drug HOPE Lipid-lowering drug No lipid-lowering drug EUROPA -Blockers No -blockers -Blockers HOPE No -blockers 0.6 0.8 1.0 2.0 Hazard ratio EUROPA: perindopril 8 mg HOPE:ramipril 10 mg EUROPA Investigators. Lancet. 2003;362:782-8. Dagenais GR et al. Circulation. 2001;104:522-6.
PEACE: Prevention of Events with Angiotensin Converting Enzyme inhibition Objective: Assess effect of ACEI in patients with stable CAD and normal/slightly reduced LV function Design: 8290 patients randomized to trandolapril 4 mg or placebo Follow-up: 4.8 years Primary outcome: CV death, nonfatal MI, CABG, PCI PEACE Trial Investigators. N Engl J Med. 2004;351:2058-68.
PEACE: Primary outcome CV death, MI, CABG/PCI; N = 8290 4% Risk reduction HR 0.96 (0.88–1.06) P = 0.43 30 Placebo Trandolapril 4 mg 25 20 % Patients 15 10 5 0 1 2 3 4 5 6 Time (years) PEACE Trial Investigators. N Engl J Med. 2004;351:2058-68.
ACEI outcome trials in CAD patients without HF EUROPA Investigators. Lancet. 2003;362:782-8. HOPE Study Investigators. N Engl J Med. 2000;342:145-53. PEACE Trial Investigators. N Engl J Med. 2004;351:2058-68. Pitt B et al. Am J Cardiol. 2001;87:1058-63.
ACEI outcome trials in CAD patientswithout HF: Key baseline characteristics HOPEEUROPA PEACEQUIET N 9,297 12,218 8,290 1,750 Follow-up (yrs) 4.5 4.2 4.8 2.3 ACEI/dose (mg) R-10 P-8 T-4 Q-20 Age (yrs) 66 60 64 58 Men (%) 73 85 82 82 CAD/Cor rev (%) 80/44 100/55 100/72 100/100 Diabetes (%) 39 12 17 16 HTN (%) 47 27 46 47 Prior MI (%) 53 65 55 49 EF NA NA 58 59 PVD (%) 43 7 NA NA EUROPA Investigators. Lancet. 2003;362:782-8. HOPE Study Investigators. N Engl J Med. 2000;342:145-53. PEACE Trial Investigators. N Engl J Med. 2004;351:2058-68. Pitt B et al. Am J Cardiol. 2001;87:1058-63.
ACEI outcome trials in CAD patients without HF: CV therapies at entry/during study EUROPA Investigators. Lancet. 2003;362:782-8. HOPE Study Investigators. N Engl J Med. 2000;342:145-53. PEACE Trial Investigators. N Engl J Med. 2004;351:2058-68. Pitt B et al. Am J Cardiol. 2001;87:1058-63. *at study end†at 3 yrs
ACEI outcome trials in CAD patients without HF: BP at entry/during study EUROPA Investigators. Lancet. 2003;362:782-8. HOPE Study Investigators. N Engl J Med. 2000;342:145-53. PEACE Trial Investigators. N Engl J Med. 2004;351:2058-68. Pitt B et al. Am J Cardiol. 2001;87:1058-63. Sleight P et al. Lancet 2001;358:2130-1.
ACEI outcome trials in CAD patients without HF: Differences in baseline CV risk 3.0 2.7 2.0 2.0 1.8 Annualized event rate in placebo group (%/yr) 1.5 1.1 1.0 1.0 0.8 0.7 0.0 CV death Nonfatal MI HOPE PEACE QUIET EUROPA HOPE Study Investigators. N Engl J Med. 2000;342:145-53. EUROPA Investigators. Lancet. 2003;362:782-8. PEACE Trial Investigators. N Engl J Med. 2004;351:2058-68. Pitt B et al. Am J Cardiol. 2001;87:1058-63.
ACEI outcome trials in CAD patients without HF: Annualized all-cause mortality— placebo vs general population Age group 65–74 years 55–64 years 3.0 2.7 2.4 All-cause mortality rate (%/yr) 2.0 1.7 1.6 1.4 1.0 1.0 0.0 HOPE (66*) PEACE (64*) EUROPA (60*) QUIET(58*) Generalpopulation Generalpopulation HOPE Study Investigators. N Engl J Med. 2000;342:145-53. EUROPA Investigators. Lancet. 2003;362:782-8. PEACE Trial Investigators. N Engl J Med. 2004;351:2058-68. Pitt B et al. Am J Cardiol. 2001;87:1058-63. Anderson RN, Smith BL. Natl Vital Stat Rep. 2005;53:1-90. *Mean age in years
ACEI outcome trials in CAD patients without HF: Annualized CV mortality—placebo vs general population Age group 65–74 years 55–64 years 2.0 1.8 1.5 CV mortality rate (%/yr) 1.0 1.0 0.8 0.7 0.7 0.5 0.3 0.0 Generalpopulation HOPE (66*) Generalpopulation PEACE (64*) EUROPA (60*) QUIET(58*) HOPE Study Investigators. N Engl J Med. 2000;342:145-53. EUROPA Investigators. Lancet. 2003;362:782-8. PEACE Trial Investigators. N Engl J Med. 2004;351:2058-68. Pitt B et al. Am J Cardiol. 2001;87:1058-63. Anderson RN, Smith BL. Natl Vital Stat Rep. 2005;53:1-90. *Mean age in years
ACEI outcome trials in CAD patients without HF: Cumulative evidence Pooled all-cause mortality results No. of deaths/no. of patients (%) ACEI Control P ACEI Control 569/4652(12.2) 482/4645 (10.4) 0.005 HOPE 420/6108(6.9) 375/6110 (6.1) 0.098 EUROPA 299/4158 (7.2) 334/4132(8.1) 0.126 PEACE 1156/14,913 (7.8) Total 1323/14,892 (8.9) < 0.001 0.6 0.8 1.0 3.0 5.0 Odds ratio Yusuf S, Pogue J. N Engl J Med. 2005;352:937-9.
ACEI outcome trials in CAD patients without HF: Totality of trial evidence HOPE, EUROPA, PEACE, QUIET Event rate (%) P ACEI Placebo Favors ACEI Favors placebo 0.0004 All-cause death 7.5 8.9 0.86 MI 6.4 7.7 0.0004 0.86 Stroke 2.1 2.7 0.0004 0.77 Revascularization 15.5 16.3 0.025 0.93 0.5 0.75 1 1.25 Odds ratio Pepine CJ, Probstfield JL. Vasc Bio Clin Pract. CME Monograph; UF College of Medicine. 2004;6(3).
CAMELOT: Trial of BP reduction with ACEI or CCB in CAD patients without HF Study design: Randomized, double-blind, multicenter, 24-month trial in patients with angiographically documented CAD, LVEF ≥40%, and no HF (N = 1991) Treatment: Amlodipine (10 mg), enalapril (20 mg), or placebo added to background therapy with -blockers and/or diuretics Primary outcome: Incidence of CV events for amlodipine vs placebo IVUS substudy: Measurement of atherosclerosis progression using IVUS (n = 274) Outcome: Change in percent atheroma volume Nissen SE et al. JAMA. 2004;292:2217-26.
CAMELOT: Reduction in primary outcome with amlodipine and enalapril 0.25 HR (95% CI) A vs P: 0.69 (0.54–0.88) E vs P: 0.85 (0.67–1.07) A vs E: 0.81 (0.63–1.04) P = 0.16 0.20 P = 0.003 P = 0.1 0.15 Cumulative CV events (proportion) Placebo 0.10 Enalapril Amlodipine 0.05 0 0 18 24 6 12 Months Nissen et al. JAMA. 2004;292:2217-26. Primary outcome = incidence of CV events
CAMELOT: Clinical implications • Optimal BP levels in CAD patients may be ~120 mm Hg systolic • Regression of CAD suggested with systolic BP reduction >10 mm Hg • Hemodynamic effects may also modulate clinical outcome • Increasing evidence to support the following strategies:– Combinations of drugs with differing modes of action– Lower BP targets in special populations Pepine CJ. JAMA. 2004;292:2271-3.
ACEI outcome trials in CAD patients without HF: Clinical implications • Cumulative evidence supports ACE inhibitors for stable CAD patients with/without clinical signs of HF • Not all ACE inhibitors can be assumed to have comparable effects for all indications • – Dose and individual properties of ACEIs are important • Benefit may depend on risk level – Benefit may be less in patients with well controlled risk factors • Randomized clinical trial evidence and guidelines should guide selection of effective ACE inhibitor and dose for CAD patients without HF Pitt B. N Engl J Med. 2004;351:2115-7.
Factors that may lead to divergent results in ACEI trials • Underdosing – Dose-related effects on vascular and myocardial tissue – Dose for CAD patients can’t be predicted from studies in HF or hypertension • Differences may exist among ACEIs • Differences in baseline risk (age, diabetes, HTN, PAD) • Inclusion of revascularization in primary outcome • Lack of power • Poor adherence to assigned treatment Pitt B et al. Am J Cardiol. 2004;87:1058-63. Yusuf S, Pogue J. N Engl J Med. 2005;352:937-8. Pitt B. N Engl J Med. 2004;351:2115-7. Pepine CJ, Probstfield JL. Vasc Bio Clin Pract. CME Monograph; UF College of Medicine. 2004;6(3).