Download
1 / 39
390 likes | 532 Vues
研究室 論文 報告. 進階的地層 岩石力學耦合網格技術 Improved Gridding Technique for Coupling Geomechanics to Reservoir Flow. 報告人: 陳璽元 指導 教授 :謝秉志 助理 教授 共同指導教授:林再興 教授. 中華民國 102 年 9 月. Outline. Introduction Basic Equations Grid Coupling

E N D
研究室論文報告 進階的地層岩石力學耦合網格技術Improved Gridding Technique for Coupling Geomechanicsto Reservoir Flow 報告人:陳璽元 指導教授:謝秉志 助理教授 共同指導教授:林再興 教授 中華民國102年9月
Outline • Introduction • Basic Equations • Grid Coupling • Application • Conclusions • DIY
Introduction • This paper describes in detail the dual-grid concept in the contextof an iterative coupling approach for hydrocarbon reservoirsimulation. • The use of this grid coupling approach reduces thesimulation run time substantially with results that are very closeto the single-grid method.
Basic Equations • The basic equations utilized by various authors (Pao et al. 2001;Du and Wong 2005) can be decomposed into two sets: one setcontaining geomechanics variables such as displacement, stress,and strain and the other set containing primary flow variables suchas pressure and temperature. • In the iterative coupling approach, • reservoir simulator :pressureand temperature • geomechanics simulator :displacement, strain, andstress
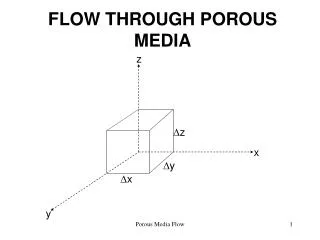
For Reservoir Flow Φ*=reservoir porosity ρf= fluid density (kg/m3) k = absolute permeability tensor (m2) p = pressure (Pa) b = body force/unit mass of fluid (m/s2) Qf= flow rate of fluid at source or sink location Qh= heat loss or gain (J) Uf= internal energy of fluid (J/gmole) Ur= internal energy of solid rock (J/m3) Hf= enthalpy of fluid (J/gmole) wA:自然裂縫寬度,ft km:地層基質滲透率,md ky:Y方向滲透率,md kx:X方向滲透率,md dA:自然裂縫間距,ft
For Geomechanics βr= linear thermal expansion coefficient of solid rock (1/°C) ρr= solid grain density (kg/m3) B = body force/unit mass of solid rock (m/s2) σ'= effective stress tensor (Pa) C = tangential stiffness tensor (Pa) u = displacement vector (m/s) α= Biot’sconstant I = identity matrix Ɛ= strain tensor (m/m) wA:自然裂縫寬度,ft km:地層基質滲透率,md ky:Y方向滲透率,md kx:X方向滲透率,md dA:自然裂縫間距,ft
Relation between geomechanicsandflow • A link between geomechanicsandflow can be represented by the following equation that relates thereservoir porosity Φ* to the volumetric strain and true porosity(Settariand Mourits 1998): where Ɛvis the volumetric strain and Φis the true porosity.
Grid Coupling • Reservoir grid ─ finite difference grid (FDG) flow variables are computed at the center of grid (pressure, temperature, initial porosity and permeability) • Geomechanics grid ─ finite element (FE) displacements are computed at the corners stresses are computed at Gaussiapoints. (displacements, stresses and strains) • There are essentially two types of mapping: • (1) from reservoir grid to finite element and • (2) from finite element to reservoir grid.
Mapping Reservoir Grid to Finite Element • Step 1: Determine the nodal location of a finite element with respect to the reservoir grid. If a finite element node does not lie inside a reservoir grid, there is no pressure or temperature applied to it. • Step 2: Determine which reservoir gridblocks have their center located inside the finite element. N is the number of elements attached to Node 1 and Pm1 is pressure applied to Node 1 of element m. where pi is pressure of reservoir gridblocki, Li is distance from the center of reservoir grid ito Node 1, and n is the weighting power.
Mapping Finite Element to Reservoir Grid • Before performing the mapping, locations must be determined for the reservoir gridblock center and corners with respect to the finite elements. where Riis the distance from Point A to Node iof the finite element; n is the inverse-distance weighting power (usually equal to 2) and uiis the displacement value at Node i.
Application Modeling Surface Deformation during CO2 Storage
Modeling Surface Deformation during CO2 Storage • Case A - comprising of non-coincidental or dual grids, one for the reservoir and the other for geomechanics, and • Case B - comprising of single grids i.e., same grids for reservoir as well as for geomechanics.
Reservoir introduction 5000 ft Overburden 1000 ft Cap rock Compressibility=7.5E-6/psi pref=2600psi kv=1.5md phi=0.21 kh=15md kv=1.5md phi=0.21 T=200oF 600 ft Aquifer
Grid system-case A • The Case A consists of 105×105×30 grids for the aquifer model. • The geomechanical grid in Case A encompasses the storage-reservoir as well the surrounding rocks, i.e., over-, side- and under-burdens, consisting of 25×25×38 gridblocks.
Grid system-case B • The Case B consists of 111×111×38 gridblocks for both the aquifer and the geomechanics model.
Results of pressure response and dissolved CO2 • CO2 is injected into the aquifer for a period of 10 years. • Gas rate = 50×106ft3/day. • Max bottomholepressure = 5000 psia. • The injector is shutin thereafter and the aquifer behavior is observed for the next 10 years.
Variation of heave during the modeling • It is observed that as more and more CO2 is injected into the aquifer, the pressure in the aquifer increases locally reducing the mean effective stress. This causes upliftment in the aquifer, accordingly the heave increases successively from year 1 to year 10 as seen in Fig. 18. • After the 10th year when injection stops, high pressure continues dissipating to the horizontal boundary and in absence of injected material it reduces at the central gridblock at the top of the aquifer.
Comparing with computation time of case A and B • In example 2 use of 23,750 gridblocks for geomechanics calculations in a dual grid case was found to produce results close to using 468,198 gridblocks on a single grid system. • The saving in geomechanical calculations was more than 10 fold.
Conclusions • An improved gridding technique developed earlier has been extended for coupling between a geomechanics module and an equation-of-state compositional simulator. • The examples presented in this paper suggest that it is possible to get satisfactory results for geomechanical effects by using dual grids at a substantially reduced computational time and memory requirement, for stress-sensitive reservoirs where compositional processes like water-alternating-gas injection and CO2 storage are required to be modeled. • The dual grid technique is quite flexible allowing for any type of grid for fluid flow and a completely different type of grid for geomechanics. • The saving in computational time and memory requirement is complementary to making the coupled fluid flow and geomechanicssimulations more efficient and faster by other means like parallel computation and improvement in coupling algorithms.
DIY Do it yourself
CMG-GEM-指令 *GEOMECH *GEOGRID GCART 100 3 20 *GDI GCON 75.6 *GDJ GCON 60 *GDK Gcon 50 *GEODEPTH *GTOP 1 1 1 7000
Reservoir Grid I-JView 180ft 800 ft 800 ft 5960 ft Overburden I-KView Cap rock 1000 ft Aquifer
Geomechanic Grid I-JView 180ft 7560 ft Overburden I-KView Cap rock 1000 ft Aquifer
Results of pressure response and dissolved CO2 • CO2 is injected into the aquifer for a period of 2000 days. • Gas rate = 50×106ft3/day. • Max bottomholepressure = 5000 psia. • The injector is shutin thereafter and the aquifer behavior is observed for the next 10 years.