Download
1 / 35
380 likes | 1.49k Vues
Optical Properties of Nanomaterials. David G. Stroud , Department of Physics , Ohio State University Columbus OH 43210 Work supported by NSF Grant DMR01-04987, the

E N D
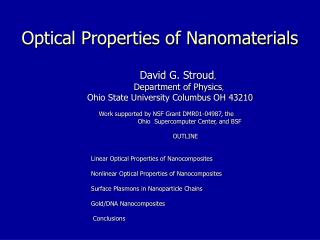
Optical Properties of Nanomaterials David G. Stroud, Department of Physics, Ohio State University Columbus OH 43210 Work supported by NSF Grant DMR01-04987, the Ohio Supercomputer Center, and BSF OUTLINE Linear Optical Properties of Nanocomposites Nonlinear Optical Properties of Nanocomposites Surface Plasmons in Nanoparticle Chains Gold/DNA Nanocomposites Conclusions
“Labors of the Months” (Norwich, England, ca. 1480).(The ruby color is probably due to embeddedgold nanoparticles.)
What is the origin of the color? Answer: ``surface plasmons’’ • An SP is a natural oscillation of the electron gas inside a goldnanosphere. • If the sphere is small compared to a wavelength of light, and the light has a frequency close to that of the SP, then the SP will absorb energy. • The frequency of the SP depends on the dielectricfunction of the gold, and the shape of the nanoparticle. For a spherical particle, the frequency is about 0.58 of the bulkplasmafrequency. Thus, although the bulk plasma frequency is in the UV, the SP frequency is in the visible (in fact, close to 520 nm)
Sphere in an applied electric field Metallic sphere Incident electric field is E_0exp(-i w t) EM wave Surface plasmon is excited when a long-wavelength electromagnetic wave is incident on a metallic sphere
Effective conductivity ofa random metal-insulator composite in the effective-medium approximation Note the broad ``surface plasmon peak and the narrow Drude peak above the percolation threshold. [D. Stroud, Phys. Rev. B19, 1783 (1979)]
Effective conductivity of a composite of Drude metal and insulator: dots, numerical; full curves, effective-medium approximation. [From X. Zhang and Stroud, PRB49, 944 (1994).]
Theory and experiment for transmissionthrough Ag/SiO2 films Theory: Maxwell-Garnett approximation (MGA) and effective-medium approximation (EMA) [D. Stroud,Phys. Rev. B19, 1783 (1979)] ; Experiment [Priestley et al, Phys. Rev. B12, 2121 (1975)]. (f is the volume fraction of Ag.)
Nonlinearopticalpropertiesofnanomaterials • Supposewehavea suspensionofnanoparticlesina host(orsomeothercompositewhichisstructuredonthenanoscale). • IfanEMwaveisapplied, thelocalelectricfieldmaybehugelyenhanced near an SP resonance. • Ifso,one expects various nonlinearsusceptibilities, whichdependonhigherpowersof the electric field, to be enhancedevenmore.
The Kerr Susceptibility is defined by where D is the electric displacement, E is the electric field, and epsilon and chi are the linear and nonlinear electric susceptibilities. If the electric field is locally large, as near an SP resonance, then its cube is correspondingly larger. Thus, near an SP resonance, one expects a huge enhancement of the cubic nonlinear (Kerr) susceptibility.
Kerr susceptibility for a dilute suspension of coated spheres Cubic nonlinear (Kerr) susceptibility for a dilute suspension of coated metal particles in a glass host, calculated in Maxwell-Garnett approximation [X. Zhang, D. Stroud, Phys. Rev. B49, 944 (1994)]. Inset: linear dielectric function of same composite. Left and right are for two coating dielectric constants.
Kerr enhancement factor for metal-insulator composite Kerr enhancement factor for a random metal-insulator composite, assuming (left) metal and (right) insulator is nonlinear. Calculation is carried out numerically, at the metal-insulator percolation threshold.
Real and imaginary parts of the SHG susceptibility for a dilute suspension of of metal spheres coated with a nonlinear dielectric[Hui, Xu, and Stroud, Phys. Rev. B69, 014203 (2004)] Left and right panels show susceptibility enhancement per unit volume of nonlinear material for two different ratios of coating thickness to metal particle radius.
Real and imaginary parts of the THG susceptibility for a dilute suspension of coated metal spheres in a dielectric host Susceptility enhancement per unit volume for third-harmonic generation (THG) for coated metal sphere suspension [from Hui, Xu, and Stroud, PRB69, 014202 (2004)]
Faraday Rotation in Composites:enhanced near SP resonance Real and imaginary parts of the Faraday rotation angle in a composite of Drude metal and insulator in a magnetic field (Xia, Hui, Stroud, J. Appl. Phys. 67, 2736 (1990)
Faraday rotation in granular ferromagnets Frequency-dependence of the real and imaginary parts of the Faraday rotation angle for a dilute suspension of ferromagnet in an insulator at two different temperatures below the Curie temperature [Xia, Hui, and Stroud, J. Appl. Phys. 67, 2736 (1990)].
Nanoparticle chain d Surface plasmons can propagate along a periodic chain of metallic nanoparticles (above) a
Photon STM Image of a Chain of Au nanoparticles [from Krenn et al, PRL 82, 2590 (1999)] Individual particles: 100x100x40 nm, separated by 100 nm and deposited on an ITO substrate
Calculation of SP modes in nanoparticle chain • In the dipole approximation, there are three SP modes on each sphere, two polarized perpendicular to chain, and one polarized parallel. The propagating waves are linear combinations of these modes on different spheres. • In our calculation, weincludeallmultipoles, not just dipoles. Then there are a infinite number of branches, but only lowest three travel with substantial group velocity. • Can be compared to nanoplasmonicexperiments, as discussed by Brongersma et al [Phys. Rev. B62, 16356 (2000) and S. A. Maier et al [Nature Materials 2, 229 (2003)]
Surface plasmon dispersion relations, nanoparticle chain Calculated surface plasmon dispersion relations (left) and group velocity of energy for the lowest two bands in a metal nanoparticle chain. Solidcurves: Lmodes; dottedcurves: Tmodes. Light curves; dipole approximation; dark curves, including allmultipoles. a/d=0.45 [from S. Y. Park and D. Stroud , Phys. Rev. B (in press); a= particleradius; d= particleseparation]
Composites of Au nanoparticles and DNA strands • Suppose we put Au nanoparticles and DNA strands in an acqueous suspension. • Certain DNA strands (capped with thiol groups) can attach to Au. • At high T, Au particles float in suspension, with DNA strands attached. • At low T, strands on different grains react to form links. Particles agglomerate to form a gel-like structure. • This behavior is easily detected optically.
Methodology • To determine structure, we calculate the probability that any two bonds on different Au particles form a link, using an equilibrium condition from simple chemical reaction theory. • Structure determined by twodifferentmodels: (i) Percolationmodel; (ii) More elaborate model involving reaction-limitedcluster-clusteraggregation (RLCA) • To treat optical properties (for any given structure) use the ``Discrete Dipole Approximation’’ (multiple scattering approach). • References: S. Y. Park and D. Stroud, Phys. Rev. B67, 212202 (2003); B68, 224201 (2003).
Au/DNA suspension in liquid state • At high T, Au particles float around in aqueous suspension. Single strands of DNA capped with thiol groups are attached.
Melting of Au/DNA cluster, two different models (a), (b) and (c) are a percolation model: all particles on a cubic lattice. (a): all bonds present; (b) 50% of bonds present; (c) 20% of bonds present. (d) Low temperature cluster formed by reaction-limited cluster-cluster aggregation (RLCA)
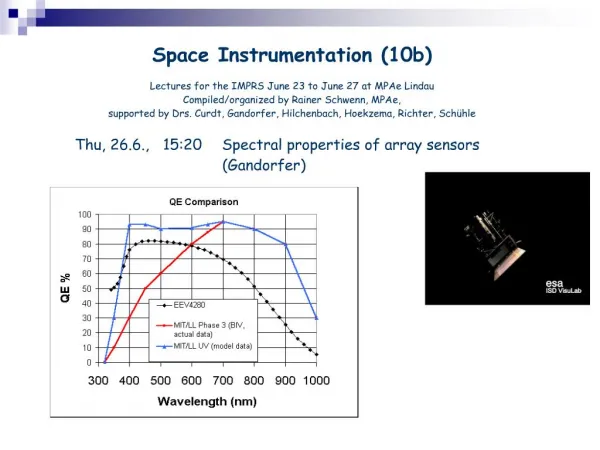
Extinction coefficient, dilute suspension Calculated (full curves) and measured (dashed curves) extinction coefficient for a dilute Au suspension, plotted versus wavelength
Extinction coefficient for compact Au/DNA clusters • Extinction coefficient per unit volume, plotted versus wavelength (in nm) for LxLxL compact clusters, as calculated using the Discrete Dipole Approximation (DDA) (from Park and Stroud, 2003)
Calculated extinction coefficient, RLCA clusters Calculated extinction coefficient versus wavelength for RLCA clusters with number of monomers varying from 1 to 343.
Extinction coefficient versus wavelength, percolation model Extinction coefficient versus wavelength for different fractions p of Au nanoparticles on a 10 x 10 x 10 simple cubic lattice. ``p=0’’ represents an isolated Au particle. Inset: C, B, and A are isolated particles, compact clusters, and RLCA clusters. Melting more closely resembles a transition from C to A in experiments.
Observed absorptance: comparison of unlinked and aggregated Au nanoparticles Absorptance of unlinked and aggregated Au nanoparticles, as measured by Storhoff et al [J. Am. Chem. Soc. 120, 1959 (1998)]
Calculated extinction coefficients versus temperature at 520 nm Normalized extinction coefficient at wavelength 520 nm, calculated for two different models, plotted vs. temperature in C. Full curves: percolation model (3 diff. Monomer numbers). Open circles: RLCA model.
Extinction coefficient vs. T at 520 nm for different particle sizes Calculated extinction coefficient versus T at wavelength 520 nm for particle radius 5, 10, and 20 nm. Inset: comparison of extinction for percolation model (open circles) and RLCA model (squares). Full line in inset is probability that a given link is broken at T.
Measured extinction at fixed wavelength vs. temperature (left) extinction of an aggregate (full curve) and isolated particles (dashed) at 260nm. [Storhoff et al, JACS 122, 4640 (2000)]. (right) extinction of an aggregate at 260 nm made from Au particles of three different diameters [C. H. Kiang, Physica A321, 164 (2003)]
Linker DNA DNA/Au nanocomposite system 1. Expected phase diagram Gel-sol transition melting transition 0 T gel sol Ind. particles R.Elghanian, et.al., Science277, 1078 (1997). 3. DDA calculation (left) of extinction cross section (S. Y. Park and D. Stroud, Phys. Rev. B68 (224201 (2003) 2. Morpologies from a structural model Experiment gel sol melting transition Gel-sol transition near melting transition R. Jin, et. al, J. Am. Chem. Soc. 125, 1643 (2003).
Work in Progress • More realistic model for gold/DNA nanocomposites • Selective detection of organic molecules, using gold nanoparticles • SP dispersion relations in other nanoparticle geometries • Diffuse and coherent SHG and THG generation • Control of SP resonances using liquid crystals.
CurrentCollaborators • Dr. Sung Yong Park, Prof. Pak-Ming Hui, Kwangmoo Kim, Ivan Tornes, Dr. Ha Youn Lee, Prof. Brad Trees, Prof. David J. Bergman, Prof. Y. M. Strelniker, Dr. W. A. Al-Saidi, D. Valdez-Balderas, Ivan Tornes, K. Kobayashi • Work Supported by the U. S. National Science Foundation, U. S.-Israel Binational Science Foundation, and Ohio Supercomputer Center.