This Week
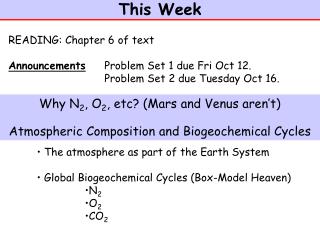
This Week. READING: Chapter 3 of text Announcements Problem Set 1 due Mon Oct 8. Office hours will be. Describing and Predicting Change. Mass Balance: Sources - Sinks Lifetime / Residence Time Steady – State Models. Today: Describing change composition.

This Week
E N D
Presentation Transcript
This Week READING: Chapter 3 of text Announcements Problem Set 1 due Mon Oct 8. Office hours will be Describing and Predicting Change • Mass Balance: Sources - Sinks • Lifetime / Residence Time • Steady – State • Models
Today: Describing change composition • Goal of Atmospheric Chemistry • Concept 1: Mass Balance • Concept 2: Lifetime
Primary Goal of Atmospheric Chemistry To describe the change in the atmospheric concentration of chemicals as a function of time and location.
CO2 Rate of Change Give at least two rates of change for CO2 What do we learn about the sources and removal of atmospheric CO2 based on this graph/analysis?
Factors Affecting d[X]/dt in a Box O2 X O3 O2 O XO Anthropogenic Biogenic Natural Emissions Transport X Flux out or Flux in Chemistry X X X Wet Deposition Dry
Atmospheric Lifetimes Lifetime = Amount Removal Rate B X X X X Z A Chemical lifetime/s Transport lifetime Deposition lifetime Sink-specific lifetimes allow determination of the importance of a particular process for controlling the fate of a species
Questions • CO2 is lost from the atmosphere by photosynthesis and physical dissolution into the oceans. Photosynthesis by the biosphere leads to the uptake of ~ 60 Pg C/yr of atmospheric CO2. The oceans take up CO2 at about the same rate. Based on these values, what are the sink-specific and overall lifetimes of CO2? What does this calculation suggest about “fixing global warming”? • 2. Fossil fuel burning and deforestation are the major anthropogenic sources of CO2 to the atmosphere. Given that CO2 was ~ constant before the industrial revolution, it appears these are the dominant sources of new CO2. Together, they add 8 Pg C/yr of CO2. Given the measured atmospheric growth rate of CO2 we determined last class (2ppm/yr), derive a second estimate of the atmospheric lifetime of CO2. • 3. Shouldn’t 1 and 2 give the same result?
Steady-State: When is it the case? Steady state solution (dm/dt = 0) Initial condition m(0) • Characteristic time t = 1/k for • reaching steady state • decay of initial condition
Today: Models Reading: Chapter 3 in text One-box Models Multi-box Models Moving the Box Model
Model Development and Application Loop USE MODEL make hypotheses or predictions DEFINE PROBLEM Urban air pollution Stratospheric Ozone Depletion Atmosphere-Ocean interactions DESIGN MODEL (make simplifications) TEST MODEL with observations Models are simplified representations of reality. Observations of the real system are required to test the model.
One Box Model Chemical production Chemical loss Inflow Fin Outflow Fout X L P Atmospheric “box”; spatial distribution of X within box is not resolved D E Deposition Emission mass balance: lifetime:
Column Model: A Moving Box If X has first order loss, then in column moving across city [X] x 0 L Typically temperature inversion defines “mixing depth” Emission FluxE (amnt/cm2/s)
Questions • Choose the most appropriate modeling strategy for the following problems (1-box, 2-box, n-box, plume/column model): • a. exchange of a uniformly mixed greenhouse gas between the stratosphere and troposphere • b. production of ozone downwind of an urban area • c. the vertical and horizontally resolved abundance of a reactive emission like CO. • 2. Suppose operators of a 1-box model of Seattle’s urban “air shed” predicted that the concentration of pollutant emitted downtown was going to rise to a unhealthy level in the U-District. Should you believe them, why or why not?