Download
1 / 19
190 likes | 506 Vues
Whole genome association mapping of beta- glucan content ir barley. Ieva Mežaka, Nils Rostoks. State Priekuli Plant Breeding Institute Faculty of Biology, University of Latvia. Introduction. (1 →3)(1 →4 )- β -D-glucan is a major constitutent of barley cell wall

E N D
Wholegenomeassociationmappingof beta-glucancontent ir barley Ieva Mežaka, Nils Rostoks State Priekuli Plant Breeding Institute Faculty of Biology, University of Latvia Advances in Plant Biotechnology in Baltic Sea region
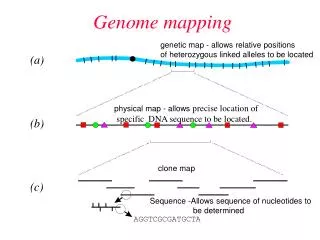
Introduction • (1 →3)(1 →4 )-β-D-glucan is a major constitutent of barley cell wall • Its content in barley grain determins it’s end use • Low β-glucan content is favourable for malt and feed • High β-glucan content is favourable for food as it helps to lower blood sugar level and cholesterol therefore reduces risk of coronary heart disease and type II diabetes. • It is necessary to know the genetic basis of inheritance of the trait to have a success in breeding • b-glucan content before has been mapped only in bi-parental mapping populations, results have been dependent on population Advances in Plant Biotechnology in Baltic Sea region
PublishedQTLsfor beta-glucancontentinbarleygrain Molina-Cano et al. 2007 Han et al. 1995 Kim et al. 2004 Li et al. 2008 Advances in Plant Biotechnology in Baltic Sea region
Aim • To map b-glucan content in Latvian barley varieties and breeding lines using association (linkage disequilibrium– LD) mapping approach Advances in Plant Biotechnology in Baltic Sea region
(Latvian) Barley germplasm • 23 Latvian barley varieties Selections from local landraces, crosses with Nordic, German and Czech varieties and breeding lines • 72 Latvian barley breeding lines Crosses of Latvian barley varieties with diverse germplasm from Europe and North America (hulless barley, donors of resistance to loose smut and mildew) Advances in Plant Biotechnology in Baltic Sea region
Phenotyping Priekuļi Stende • State Priekuļi plant breeding institute, State Stende cereal breeding institute • years 2007.-2009. • 3 replicates • β- glucan content detected by Infratec™ 1241 Grain Analyzer from Foss Advances in Plant Biotechnology in Baltic Sea region
Genotyping • Illumina GoldenGate platform • 1536 SNP – each SNP corresponds to a single gene • Most of SNPs have been mapped (Close et al., 2009, BMC Genomics) • 1325 polimorfic SNP have been used for association mapping • Average distance between SNP markers ~1 cM • Average distance between SNPs with significant (P < 0.001; r2 > 0.5) linkage disequilibrium - 1.5 cM Advances in Plant Biotechnology in Baltic Sea region
Association mapping • Computerprogrammforplantassociationnmapping “Tassel” implementingfourstatisticalmodels: • GLM (generallinearmodel) • GLM+Q • MLM (mixedlinearmodel)+Q+Ktassel • MLM+Q+Kspagedi • Q – infomationonstructuredassociation, calculatedwithcomputerprogram “Structure”. • K – kinshipmatrix, calculatedwithcomputerprogram “Tassel” or “Spagedi” • SNPswithminorallelefrequency> 0.1 • β- glucancontent – averageoverthreereplications, twolocations (Stende and Priekuļi) andthreeyears (2007-2009) • QTL weredeclairedsignificantonlyiftheyweresignificantinall 6 environmentsafter p-valuecorrectionbyBonferonimethod. Advances in Plant Biotechnology in Baltic Sea region
Principal coordinates analysis Advances in Plant Biotechnology in Baltic Sea region
b-glucan content in grain Advances in Plant Biotechnology in Baltic Sea region
Genotype and environment effect on β- glucan content in grain Advances in Plant Biotechnology in Baltic Sea region
Statistical models Cumulative frequencies Cumulative frequencies Cumulative frequencies P-value P-value P-value Cumulative frequencies Cumulative frequencies Cumulative frequencies Advances in Plant Biotechnology in Baltic Sea region P-value P-value P-value
2007 • 2008 • 2009 • SPPBI • SSCBI Advances in Plant Biotechnology in Baltic Sea region
Influence ofnudgeneonb-glucancontentinhulledandhullesgenotypes • nud locus determines hullless genotype • All accessions were genotyped at nud locus with indel marker developed by Taketa (2008) Advances in Plant Biotechnology in Baltic Sea region
2007 • 2008 • 2009 • SPPBI • SSCBI Advances in Plant Biotechnology in Baltic Sea region
2007 • 2008 • 2009 • SPPBI • SSCBI Advances in Plant Biotechnology in Baltic Sea region
Conclusions • Major QTL for beta-glucan content in hulled and hulless barley has been mapped on chromosome 7H 7 BIN, at the same location where nud gene has been mapped before. • Association mapping shows good agreement with the previously mapped β- glucan QTL in bi-parental population CDC Bold x TR251 on chromosome 7H. • To map the minor QTLs for beta-glucan content, it is necessary to enlarge the size of population and number of molecular markers. Advances in Plant Biotechnology in Baltic Sea region
Acknowledgements • SCRI (RobbieWaugh) and UCR (TimClose) for SNP genotyping • Funding: EU Structural Funds, Latvian Council of Science, Latvian National Programme in Agrobiotechnology Advances in Plant Biotechnology in Baltic Sea region