Spatial STEM :
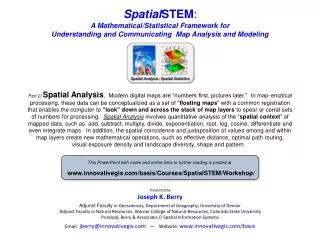
Spatial STEM :. A Mathematical/Statistical Framework for Understanding and Communicating Map Analysis and Modeling.

Spatial STEM :
E N D
Presentation Transcript
SpatialSTEM: A Mathematical/Statistical Framework for Understanding and Communicating Map Analysis and Modeling Part 2) Spatial Analysis. Modern digital maps are “numbers first, pictures later.” In map-ematical processing, these data can be conceptualized as a set of "floating maps" with a common registration that enables the computer to "look" down and across the stack of map layers to spear or corral sets of numbers for processing. Spatial Analysis involves quantitative analysis of the “spatial context” of mapped data, such as add, subtract, multiply, divide, exponentiation, root, log, cosine, differentiate and even integrate maps. In addition, the spatial coincidence and juxtaposition of values among and within map layers create new mathematical operations, such as effective distance, optimal path routing, visual exposure density and landscape diversity, shape and pattern. Part 2) Spatial Analysis. Modern digital maps are “numbers first, pictures later.” In map-ematical processing, these data can be conceptualized as a set of "floating maps" with a common registration that enables the computer to "look" down and across the stack of map layers to spear or corral sets of numbers for processing. Spatial Analysis involves quantitative analysis of the “spatial context” of mapped data, such as add, subtract, multiply, divide, exponentiation, root, log, cosine, differentiate and even integrate maps. In addition, the spatial coincidence and juxtaposition of values among and within map layers create new mathematical operations, such as effective distance, optimal path routing, visual exposure density and landscape diversity, shape and pattern. This PowerPoint with notes and online links to further reading is posted at www.innovativegis.com/basis/Courses/SpatialSTEM/Workshop/ Presented byJoseph K. Berry Adjunct Faculty in Geosciences, Department of Geography, University of Denver Adjunct Faculty in Natural Resources, Warner College of Natural Resources, Colorado State UniversityPrincipal, Berry & Associates // Spatial Information Systems Email: jberry@innovativegis.com— Website: www.innovativegis.com/basis
Vector vs. Raster Data Forms(analytical perspective) Vector(Spatial & Attribute Tables) Raster (Grid Matrix) Forest Polygons #31, #32 : ID#21 X,Y X,Y : Spatial Table Meadow Polygon #21 : : ID#21 Meadow : : Attribute Table Water Polygons #11, #12 Composite Display COVERTYPE Map Mapping/Geo-Query(Discrete, Spatial Objects) (Continuous, Map Surfaces) Map Analysis/Modeling Where– Cell Position in the matrix determines location within a continuous, regular grid What– Cell Value in the matrix indicates the classification at that location Where – a Spatial Table contains X,Y coordinates delineating the location of each point, line and polygon boundary What– a linked Attribute Table contains text/values indicating the classification of each spatial object …grid-based mapped data is “Preconditioned for Analysis” as spatial topology is inherent in the matrix (Berry)
Grid-based Data Structure (fundamental organizational concepts) AGrid Mapconsists of a matrix of numbers with a value indicating the characteristic/condition at each grid cell location— Map Stack Map Stack …forming a set of geo-registered Map Layersor“Map Stack” Vector(discrete) Raster (continuous) Contour Lines Elevation Contour Interval 2300-2500’ Grid Intervals 3D Surface (stair steps) Analysis Frame The Analysis Frame provides consistent “parceling” needed for map analysis and extends discrete Points, Lines and Polygons… Col 3, Row 22 Col 1, Row 1 Origin …to continuous Map Surfaces Data listing for a Map Stack Drill-down 3D Surface (gradient) (Berry)
Grid-based Processing Structure (data accessing and cyclic processing) Local Focal Zonal Global Template Map Entire Area Map1 Map1 Map1 Map1 Map2 Map2 Map2 Map2 Each processing step is accomplished by requiring— 1) Retrievalof one or more grid map layers from the map stack Map Stack Retrieve Manipulate “Spearing” “Plunging” “Lacing” “Funneling” 2) Manipulationof that mapped data by an appropriate math/stat operation, …collects data on a cell-by-cell basis and reports a single value on a cell-by-cell basis …collects data on a neighborhood basis and reports a single value on a cell-by-cell basis …collects data on a region-wide basis and reports summary on a region-wide basis …collects data on a map-wide basis and reports results on a map-wide or cell-by-cell basis 3) Creationof an intermediate map layer whose map values are derived as a result of that manipulation, and 4) Storageof that new map layer back into the map stack for subsequent processing. Store Create Intermediate Map Layer ...analogous to evaluating “nested parentheticals” in traditional algebra, except using map variablescomposed of thousands of spatially organized numbers %Change= ((Old – New) / Old) *100 (Berry)
Overview of Map Analysis Approaches (Spatial Analysis and Spatial Statistics) Traditional GIS Forest Inventory Map • Points, Lines, Polygons • Discrete Objects • Mapping and Geo-query Spatial Statistics Traditional Statistics Spatial Distribution (Surface) Minimum= 5.4 ppm Maximum= 103.0 ppm Mean= 22.4 ppm StDEV= 15.5 • Mean, StDev (Normal Curve) • Central Tendency • Typical Response (scalar) • Map of Variance (gradient) • Spatial Distribution • Numerical Spatial Relationships Spatial Analysis Elevation (Surface) • Cells, Surfaces • Continuous Geographic Space • Contextual Spatial Relationships …next session (Berry)
Spatial Analysis Operations(Geographic Context) GIS as “Technical Tool” (Where is What) vs. “Analytical Tool” (Why, So What and What if) Map Stack Grid Layer Spatial Analysis Spatial Analysisextends the basic set of discrete map features (points, lines and polygons) to map surfaces that represent continuous geographic space as a set of contiguous grid cells (matrix), thereby providing a Mathematical Framework for map analysis and modeling of the Contextual Spatial Relationships within and among grid map layers Mathematical Perspective: Basic GridMath & Map Algebra ( + - * / ) Advanced GridMath (Math, Trig, Logical Functions) Map Calculus (Spatial Derivative, Spatial Integral) Map Geometry (Euclidian Proximity, Effective Proximity, Narrowness) Plane Geometry Connectivity (Optimal Path, Optimal Path Density) Solid Geometry Connectivity (Viewshed, Visual Exposure) Unique Map Analytics (Contiguity, Size/Shape/Integrity, Masking, Profile) Map Analysis Toolbox …let’s consider some examples Unique spatial operations (Berry)
Calculating Slope and Flow(Spatial Derivative; Optimal Path Density) Inclination of a fitted plane to a location and its eight surrounding elevation values (Roving Window) Elevation Surface Total number of the steepest downhill paths flowing into each location (Distance) Slope(47,64) = 33.23% Slope map draped over Elevation Slope map Flow(28,46) = 451 Paths Flow map draped over Elevation Flow map (Berry)
Deriving Erosion Potential(terrain slope and surface flow) Erosion Potential Erosion_potential Slopemap Slope_classes Flow/Slope Simple Buffer Flowmap Flow_classes Protective Buffers Streams Simple Buffer …protect the fish from sediment loading by regulating adverse activity “setbacks” around spawning streams Highest erosion potential on steep slopes with heavy flows But all buffer-feet are not the same… “as the crow walks” Reclassify Reclassify Overlay Reclassify …simple distance buffers “as the crow flies” …need to reach farther in areas of high erosion potential (Berry)
Calculating Effective Distance (variable-width buffers) Distance away from the streams is a function of the erosion potential(Flow/Slope Class) …with intervening heavy flow and steep slopes computed as effectively closer than simple distance “as the crow walks” …respecting relative and absolute barriers to movement Distance Erosion Buffers Erosion_potential Streams Splash Algorithm …propagating distance waves respond to intervening conditions (relative /absolute barriers) Simple Buffers Heavy/Steep (far from stream) Light/Gentle (close) Effective Distance Buffers (draped over Elevation) Effective Buffers (digital slide show VBUFF) (Berry)
Variable-Width Buffers (Simple vs. Effective “clipped and uphill”) Simple Buffer – “as-the-crow-flies” proximity to the road; no absolute or relative barriers are considered; dark blue line indicates the full simple buffer reach (polygon) Ocean Clipped Buffer – simple proximity for just land areas Downhill Uphill Buffer – simple proximity to the road for just the areas that are uphill from the road; absolute barrier (uphill only– absolutely no downhill steps) (Berry)
Calculating Travel-time (Euclidian Proximity, Effective Proximity) OUR STORE …close to the store (blue) A store’s Simple Proximity identifies “rings” of increasing geometric distance — “concentric circles” Euclidian Proximity A store’s Travelshed identifies the relative driving time from every location to the store — analogous to a “watershed” Effective Proximity Splash Algorithm …propagating distance waves respond to intervening conditions (relative/absolute barriers) Relative scale: 1 = .05 minutes (Berry)
Ocean Ocean Competitor 1 Competitor 2 Competitor 3 Competitor 4 Competitor 5 Ocean Ocean Ocean Travel-Time for Competitor Stores (Euclidian Proximity, Effective Proximity) Ocean Our Store (#111) Travel-Timesurfaces from several stores treating highway travel as four times faster than city streets Blue tones indicate locations that are close to a store (estimated twelve minute drive or less). Customer data can be appended with travel-time distances and analyzed for spatial relationships in sales and demographic factors. (Berry)
Travel-Time Surfaces (Our Store & Competitor #4) Blue tones indicate locations that are close to a store (estimated twelve minute drive or less). Increasingly warmer tones form an ever increasing bowl-like gradient(accumulation surface) with larger travel-time values identifying locations that are farther away. Our Store Competitor (Berry)
Competition Map (Combat Zone between Our Store & Competitor #4) The travel-time surfaces for two stores can be compared (subtracted) to Identify the relative access advantages throughout the project area. Zero values indicate the same travel-time to both stores (equidistant travel-time) …yellow identifies the Combat Zone ; green Our Store advantage; red Competitor #4 advantage Competitor Our Advantage Positive 0= Equidistant Negative Our Store Competitor’s Advantage (See “Location, Location, Location: Retail Sales Competition Analysis,” posted at www.innovativegis.com/basis/present/GW06_retail/GW06_Retail.htm) (Berry)
Map Geometry & Connectivity Techniques (Travel-time and Optimal Path) Step 1)Establish off-road hiking friction that considers the relative ease of hiking through various cover types (in minutes/cell) as 2= meadow, 5= forest relative barriers and 0= open water (absolute barrier) Ranch 1= Ranch 0= All else Locations Step 2)Establish on-road bicycling friction as 1= easiest with 0= all non-road areas Ranc_eProx Roads Allroads 1= Any road 0= All else Step 3)Combine the on- and off-road friction maps such that the on-road friction takes precedent Bike_Hiking _friction <Friction Map> Hiking _friction Covertype Step 4)Isolate the starting location (ranch) Boxes represent maps Lines represent processing steps Step 5)Derive the effective proximity (Travel-time) from the Ranch to everywhere in the project area Relative/Absolute Barriers <Accumulation Surface> Accumulation Surface– identifies the Optimal Path (shortest/quickest route) from a location back to the ranch. The “steepest downhill path” retraces the effective distance wavefront that got there first. …steps 1-3)Friction Map– identifies the relative ease of travel through each map location (grid cell). …steps 4-5)Accumulation Surface– identifies the Travel-time (eProximity) from the Ranch to everywhere. Optimal Corridor Analysis– adding two effective proximity surfaces (start and end) identifies the optimal path as the minimum value and all other values as the added “opportunity cost” of forcing a route through any location in the project area. (Berry)
Optimal Path/Corridor Analysis (minimize detection/risk model) LOW Prefer Avoid HIGH Helicopter Performance Distance to Threat Overall Discrete Cost Surface (Susceptibility of Detection) Base Map Layers Least Cost Path Discrete Cost Surface sub-models Utilize additional base map layers, such as Night Lights, Population, Roads, Topography, Vegetation, etc. are used for the other Visual Exposure Optimal Path and Corridor (Minimizes Susceptibility of Detection) End “…GIS optimized flight routing plans that minimize helicopter susceptibility to detection (maximize capability to avoid threats)…” Start …figures from “Susceptibility Modeling and Mission Flight Route Optimization in a Low Threat, Combat Environment” by USAF Lt. Colonel Brett J. Machovina, June 2010, doctoral dissertation, University of Denver (Berry)
Map Geometry (Simple Euclidian and Effective Proximity) Basic Operations (Static) • Simple Proximity as the “crow flies” counting cell lengthsas it moves out as a wave front • Effective Proximity as the “crow walks” in not necessarily in • straight lines that respect absolute/ relative impedance to movement Spread operation in MapCalc Learner Operation Specifications • Nullidentifies a “Thru” surface value identifying ignored locations • Toindicates maximum distance of movement • Thru map identifying the relative/absolute impedance (discrete cost) • Over respects movement Uphill, Downhill or Across a specified surface map considering a “guiding surface” such as Elevation • Simply starts “counting” simple/effective movement from 1 • Explicitly starts “counting” from the grid location’s value thereby creating a “stepped accumulation surface” • Weighted the starter cell’s value is used as an additional weight to generate a “gravity model” solution • Back Link stores a starter ID# identifying the closest starter location) <FrictionMap> <SurfaceMap> EucDistance operation CostDistance operation in Spatial Analyst have similar capabilities Advanced Operations(Dynamic) • Accumulation (Total accumulated movement in #cells) • Momentum (Net accumulated movement considering increases/decreases in speed) • Direction (Look-up table determining the effective impedance as a function movement direction, such as uphill or downhill slopes) www.innovativegis.com/basis/MapAnalysis/Topic25/Topic25.htm (Berry)
Calculating Visual Connectivity (sequentially assessing the tangent) Splash Algorithm …propagating tangent waves carrying the “rise to run” ratio (tangent) Rise= change in elevation Run= distance away Visual Connectivity is like a rotating search light at a “viewer” location… …like proximity, Visual Connectivity starts somewhere (starter cell) and moves through geographic space by steps (wave front) noting if the ratio of rise in elevation versus the distance away (tangent) is greater than any of the previous ratios, the location is marked as seen …the beam illuminating the terrain identifies all locations that can be seen Viewshed Binary Map at least one viewer location “sees” a map location (binary seen or not seen) Visual Exposure Density Surface – counts the number of “viewers” that see each map location (relative density) Weighted Density surface – adds the viewer cell value (relative importance) (Berry)
Variable-Width Buffers (line-of-sight connectivity) Line-of-Sight Buffer– identifies land locations within 250m that can be seen from the road… 250m “viewshed” of the road(clipped to land area) Line-of-Sight Exposure– notes the number of times each location in the buffer is seen Line-of-Sight Noise– locations hidden behind a ridge or farther away from a source (road) “hear” greatly reduced noise levels …1/D2 decay function 9.2 Decibels Compute Exposure_Map * Noise_map for a relative Noise Irritability Index 92.0 (Berry)
Visual Exposure Analysis (visual vulnerability and aesthetic maps) Weighted Visual Exposure map for an ongoing visual assessment in a national recreation area. The project developed visual vulnerability maps from the reservoir and a major highway (viewer locations) running through the area. In addition, an Aesthetic Map was generated based on overall visual exposure to prettyand ugly places. (Senior Honors Thesis by University of Denver Geography student Chris Martin, 2003) (Berry)
Spatially Accessing Relevant Images (Back Azimuth and FOV) Back Azimuth Query Location The Back azimuths for the camera locations …are compared with the optical axis/field of view to determine if the camera is pointed toward the query point. Candidate imagery not oriented toward the query point are eliminated. User identifies a location of interest…then specifies a buffer distance …and the images meeting the query are listed. The direction to the imagery locations must be considered …with respect to the direction of thecamera’s optical axis and field of view. …click– and the set of potential images and video are filtered for those that are… 1) within a specified distance, 2) oriented toward the QPoint 3) and visually connected to the Query Point. Panorama #1 #4a Q “… an automated means for identifying images viewing a location through database and geo-queries greatly assists in accessing relevant images” The viewshed from the query point is calculated considering intervening terrain and cover type and the height of the camera platform. Candidate imagery not within the viewshed are eliminated. #3 #4b Panorama …early prototype technique developed for Red Hen Systems, Fort Collins, Colorado (Berry)
Solid Geometry Connectivity (Viewshed, Visual Exposure) Basic and Advanced Operations • Viewshedmarks each location that is seen from at least one “viewer” cell (binary map of seen/not seen) • Visual Exposuregenerates a “density surface” indicating the number of viewer locations (count) that see each grid location (relative density) • Weighted Visual Exposurea “density surface” of the total (sum) of the viewer weights (relative importance) • Net-Weighted Visual Exposurea “density surface” indicating the net viewer weight (arithmetic sum) byrespecting the sign of the weights (aesthetic surface where pretty= positive weight and ugly= negative) Radiate operation in MapCalc Learner • Operation Specifications • Overidentifies the visual barrier surface (usually Elevation) • Toindicates maximum viewing distance • Atindentifies the viewer height above the terrain surface • Nullidentifies an “Over” surface value indicating locations to be ignored • Opacityuses a decay function to represent reduced visibility • Thru an additional “blocking surface containing cells that block • any line of sight, such as forest canopy • Onto map containing values reflecting the height of features above the surface map, such as smokestacks that can be seen but not blocking • Simplyidentifies all locations that are seen at least once (binary) • Completelycounts the number of “viewer” cells connected (VE) • Weightedadds the connected viewer cell value (wVE and net wVE) • Degreesidentifies the maximum prominence angle of connected viewer cells <ViewerHeight> <ScreenHeights> <TargetHeights> Viewshed operation in Spatial Analyst has similar capabilities www.innovativegis.com/basis/MapAnalysis/Topic15/Topic15.htm (Berry)
Spatial Analysis Operations(Geographic Context) GIS as “Technical Tool” (Where is What) vs. “Analytical Tool” (Why, So What and What if) Map Stack Grid Layer Spatial Analysis Spatial Analysisextends the basic set of discrete map features (points, lines and polygons) to map surfaces that represent continuous geographic space as a set of contiguous grid cells, and thereby provides a mathematical/statistical framework for analyzing and modeling the Contextual Spatial Relationships within and among grid map layers Mathematical Perspective: Basic GridMath & Map Algebra ( + - * / ) Advanced GridMath (Math, Trig, Logical Functions) Map Calculus (Spatial Derivative, Spatial Integral) Map Geometry (Euclidian Proximity, Effective Proximity, Narrowness) Plane Geometry Connectivity (Optimal Path, Optimal Path Density) Solid Geometry Connectivity (Viewshed, Visual Exposure) Unique Map Analytics (Contiguity, Size/Shape/Integrity, Masking, Profile) …discussion focused on these distance related groups of operations as they are least understood by the STEM disciplines — see reading references for more information on all of the operations Map Analysis Toolbox (Berry)